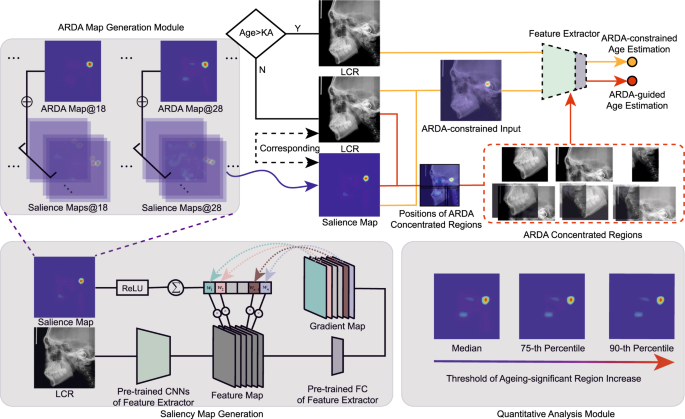
In this study, an ageing and degeneration analysis method using ARDA on LCR images is proposed. The overview of the proposed method is shown in Fig. 10. The method mainly consists of four modules: (1) a pre-trained deep learning model for ageing feature extraction, (2) ARDA generation, (3) acquisition of three ARDA concentrated regions, and (4) quantitative analysis of ageing and degeneration distribution. Among them, the ageing features extracted by the pre-trained age estimation model are used to generate ageing salience maps and obtain the ARDA map. Three ARDA concentrated regions of the LCR image are divided based on the ARDA distributions. Finally, the ARDA of both the LRC image and the ARDA concentrated regions are quantitatively analyzed at the pixel and the instance scales.
Ethics statement
This study is approved by the Affiliated Stomatological Hospital of Xi’an Jiaotong University Health Science Center (Approval number: xjkqll[2022]NO.30). The study was non-interventional and retrospective, all participants in the study signed the written informed consent, and the LCR images used in this data were anonymized. A sampled and desensitized example dataset was shared in source code repository.
Study population
We obtained LCR images from the Stomatological Hospital of Xi’an Jiaotong University Health Science Center, China. The bit depth of the images in the dataset is 16 bpp, and the size of most images is 2144 × 2304.
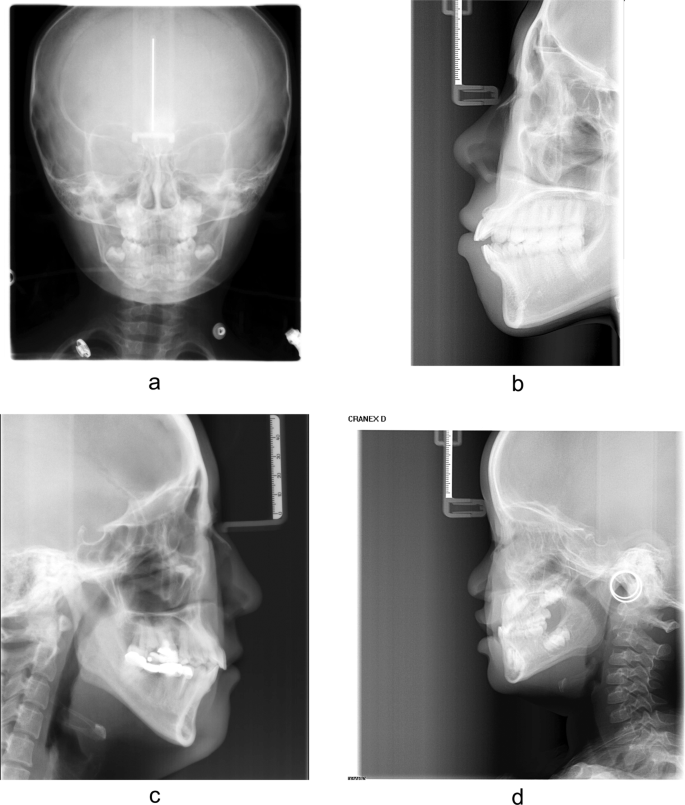
The age of the subjects was calculated by subtracting the imaging date from the date of birth and dividing by 365.25 (due to leap years) and rounding to the nearest hundredth. 20174 LCR images were divided into 7 age groups according to age after screening the unqualified images shown in Fig. 9. The age and gender distribution of the subjects are shown in Table 3. The size distribution of the LCR images is shown in Table 4.

a The actual age of the subject is less than 4 years or greater than 40 years. b Incomplete LCR image. c Subject with restorations in the teeth. d Incorrect imaging posture.
The proposed ARDA is robust to low quality images since it is based on the block-scale, high-dimensional, and abstract features of the images, and it represents the ageing regions without emphasizing pixel-scale precision. The manifestation of ARDA is the representation of the difference between the center of the ageing region from the surrounding region. Therefore, the impact on the accuracy of ARDA of the possible low quality image with blurring, low resolution, and noise is limited.
Ageing feature extraction
In this study, the ageing features of LCR images were extracted by a pre-trained CNN for age estimation. When the CNN was trained to estimate age, the smaller the error, the more accurately the ageing characteristics in the LCR image can be extracted. For the age estimation tasks using large LCR images (larger than 1500 × 2000), the balance of performance and computing resource requirements needs to be considered.
EfficientNet-B0 can achieve the best result with the fewest parameters compared with other CNNs, so it was used as the baseline age estimation model and ageing feature extractor. The performance comparison for age estimation and the number of parameters from the CNN models that perform well on natural images is shown in Table 5. These models were trained using a tiny version of the training set for quick comparison.
Efficient-B0 was trained for age estimation on the training set, in which the pre-processing process of the LCR images included contrast enhancement, shape fixing, and resizing. In addition, random affine transformation and random horizontal flip were also used for data augmentation.
The main block of Efficient-B0 is a mobile inverted bottleneck (MBConv)41,42, to which the squeeze-and-excitation optimization43 was also added. The structure of Efficient-B0 is shown in Table 6. See the Supplementary Note 1 for a detailed description of the EfficientNet model structure.
The loss function for ageing feature extractor was set as L1 loss:
$$L=frac{1}{N}mathop{sum }limits_{n=1}^{N}| {y}_{n}^{prime}-{y}_{n}|$$
(1)
where N is the number of samples, yn and ({y}_{n}^{prime}) are the age and predicted age of n-th LCR image.
The training strategy, image augmentation and preprocessing for the training process are provided in the Supplementary Note 2 and Supplementary Note 3, respectively. The fitted regression models on the true age and the age predicted by different age estimation methods are show in Supplementary Figure 1. The p-values of f-test and t-test between different age estimation methods are shown in Supplementary Table 2 and Supplementary Table 3, respectively.
ARDA generation
With the pursuit of the interpretability of deep learning methods, some methods for gradient visualization of deep CNNs have been proposed, including CAM44, Grad-CAM45, etc. The gradient visualization method can be used not only to visualize the salience region of the model, but also to represent the ageing-related attention by the ageing feature extractor. The details of the ARDA generation module are shown in Fig. 10. The global average of the gradient of the feature map in the pre-trained model is defined as its weight, and the weight of the k-th feature map inputted into the fully connected layer is calculated by
$${w}_{k}=frac{1}{Z}mathop{sum}limits_{i}mathop{sum}limits_{j}frac{partial hat{y}}{partial {F}_{ij}^{k}}$$
(2)
where, Z is the number of pixels in feature map F, (hat{y}) is the output of network, and ({F}_{ij}^{k}) is the value of pixel (i, j) in the k-th feature map. The ageing salience map M is obtained by calculating the weighted sum of all the feature maps:
$$M=ReLUleft(mathop{sum}limits_{k}{w}_{k}{F}^{k}right)$$
(3)
The ARDA map of age a is generated by:
$${A}_{a}=frac{1}{{N}_{a}}mathop{sum }limits_{n=1}^{{N}_{a}}{M}_{a,n}$$
(4)
where a ∈ {4, 5, …, 39, 40}, Na is the number of samples with age a in the training set, Ma,n is the ageing salience map corresponding to n-th LCR image of age a, and ∑ is element-wise summation.

The method includes ageing feature extraction, ageing salience map generation and ARDA generation, three ARDA concentrated regions acquisition and quantitative analysis of ageing distribution modules. The data flow of ARDA-constrained age estimation is indicated by yellow lines, while the data flow of ARDA-guided age estimation is indicated by red lines. The feature extractor and fully connected layer of the baseline model in the ARDA Map Generation Model are pre-trained.
Here, the ageing salience maps are generated by the pre-trained age estimation network which can extract generic ageing features from LCR images.
The ARDA is obtained by merging all ageing salience maps of the same age. The general distribution of the ageing salience on the LCR images can be displayed, while avoiding the effect of abnormal samples. The ARDA generated for each age can show the dynamic changes of ageing salience with age in LCR images.
Age-related changes are not significant in adults. Therefore, it is difficult to estimate accurately adult age using only LCR images. Here, we propose a method to apply salience maps as the attention constraint of the neural network, which can make use of the knowledge learned by the baseline model on all training data to all input LCR images and enable the baseline model to focus more on ageing-relevant elements.
In the training phase of the ARDA-constrained age estimation, the LCR images older than the selected KA and their corresponding salience maps are used as the input of the baseline model. Otherwise, only the LCR images are used as the input. This distinction is acceptable because age labels are available during the training phase. However, in the testing phase, as the age labels are not available, we applied a different strategy, i.e., if the predicted age from the age estimation model is greater than KA, we concatenate the LCR images and their corresponding ageing salience map as the input of the network and estimate the age again. The latter estimation result is regarded as the final estimated age. Otherwise, the result of the first test is directly used as the final estimated age. We call this method retest.
Acquisition of three ARDA concentrated regions
From forensic practice, we know that a complete LCR image is sometimes difficult to obtain, and the ageing salience of the local region in the LCR images can be achieved by analyzing the distribution of ARDA on the LCR images. The distribution of ageing salience on the LCR images represented by the ARDA is shown in Fig. 1c. These ARDA concentrated regions are the teeth, craniofacial and cervical spine regions. Under the guidance of ARDA, each LCR image in our dataset is divided into three overlapping parts with the same strategy, as the position of each part in the LCR image is fixed. We mapped the ARDA to color, ranging from blue to red, to visualize the distribution of ageing salience and ageing regions, i.e., the closer the color of the pixel is to red, the larger the ARDA of the pixel. An LCR image of an individual of the age of 28 years and its corresponding ageing salience map are shown overlapping to show the relative position relationship between the ARDA map and the LCR image in Figs. 3, 4, and 5.
Figure 6 a shows a specific LCR image with a width ({{{mathcal{W}}}}) and height ({{{mathcal{H}}}}), in which the upper left corner was set as the origin of the coordinate system, the positive x-axis is in the down direction, and the positive y-axis is in the right direction. Table 7 summarizes the coordinate of the upper left corner and the lower right corner of the three ARDA concentrated regions.
Each ARDA concentrated region of the LCR image is selected or discarded as the input of the model for comparing the performance of the age estimation and providing guidance for forensic practice, The ARDA maps of each region are also generated as the same way as we obtain the ARDA maps of the complete LCR images.
Quantitative analysis of ageing and degeneration
In this study, the quantified analysis of ARDA is performed in the time and space dimensions. In the time dimension, the patterns of dynamic salience and region of ageing with age in LCR images are analyzed. In the spatial dimension, the quantitative ageing salience of LCR images is represented on the pixel scale and the instance scale.
As shown in Fig. 1a, the size of the instances in the LCR images varies greatly. To eliminate the effect of size differences on the quantified ARDA analysis, we only calculate the mean ARDA of the ageing-significant region within each instance. The quantified ARDA generation of the instances is detailed in Supplementary Note 4.
In this study, the ageing-significant region threshold is set to the median value, the 75-th quantile and the 90-th quantile of the average ageing salience corresponding to a specific age. In Fig. 6b, c, d, the three surface plots from the bottom to top are the cases in which the ageing-significant region threshold was set to the median, 75-th and 90-th percentile of the average ageing salience, respectively.
Reporting summary
Further information on research design is available in the Nature Research Reporting Summary linked to this article.

