Ethics Statement
This study was conducted with the approval of our Institutional Review Board (IRB) (2-2015-0044) of our university dental hospital. This study had a retrospective design and all data were analyzed anonymously. The IRB of our dental hospital waived the need for individual informed consent. This study is HIPAA compliant and all methods were performed in accordance with the relevant guidelines and regulations in our dental hospital.
CBCT scans
CBCT data were randomly collected retrospectively from 30 patients (Table 1) who underwent CBCT due to clinical problems such as impacted third molar contacting the mandibular canal and temporomandibular disease between January 2015 and December 2016 in our university dental hospital, but were shown to have no pathologic bone changes in either condylar head. Patients with surgical defects, missing teeth or implants, or dental or skeletal malocclusion were excluded. The CBCT images were obtained by trained technicians, with the occlusal plane parallel to the floor and the mid-sagittal plane perpendicular to the floor. An Alphard 3030 (Alphard Roentgen Ind., Kyoto, Japan) apparatus was used to obtain CBCT images with exposure conditions of 80 kV and 5 mA with a 154 mm × 154 mm field of view.
Image processing
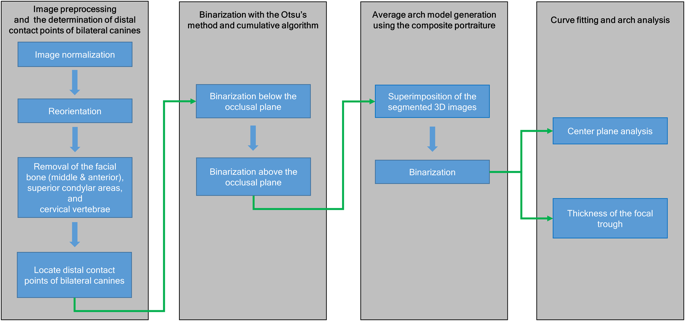
A customized computer program was made using MATLAB 2016a (MathWorks, Natick, MA, USA) and used for the generation and analysis of the average arch shape. Two dentists processed images twice at 2-week intervals. Figure 1 shows the flowchart of the image processing and analysis.
Flowchart of image processing and analysis. After image preprocessing and determination of the distal contact points of the bilateral canines, binarization and average arch shape generation were performed. The center, boundaries, and minimum thickness of the focal trough were then analyzed.
Image preprocessing and determination of the distal contact points of the bilateral canines
- 1)
Image normalization:
The intensity value of the image was normalized between 0 and 1 by using the Equation (1) below.
$$mathrm{Normalized},mathrm{image}=frac{mathrm{Original},mathrm{image}+m}{M+m}$$
(1)
where m indicates minimum pixel intensity and M refers to maximum pixel intensity.
- 2)
Reorientation (rotation of the Frankfort plane to be parallel with the floor):
- a.
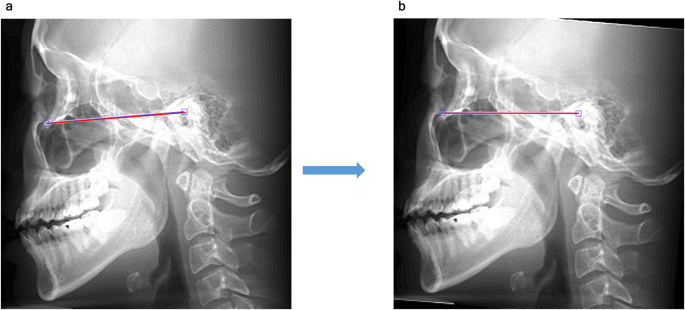
In the average intensity projection image in the sagittal direction, a Frankfort plane was drawn passing through the inferior margin of the orbit and the upper margin of the external auditory meatus (Fig. 2a).
Figure 2 
Image reorientation (sagittal). (a) Using the average intensity projection image in the sagittal direction, a Frankfort plane (red segment) was drawn passing through the 2 points defined by the inferior margin of the orbit and the upper margin of the external auditory meatus. (b) The entire image was rotated around the center of the two points for the Frankfort plane to be parallel with the floor.
- b.
The entire 3D image was rotated around the center of the 2 points for the Frankfort plane to parallel with the floor (Fig. 2b). This procedure aligns the position of the head in the image for panoramic radiography.
- 3)
Removal of the facial bone (middle and anterior), cervical vertebrae, and temporal bone superior to the condylar head:
The regions impeding segmentation were removed for the stable segmentation of the mandible.
- a.
Removal of the midfacial bone (coronal direction).
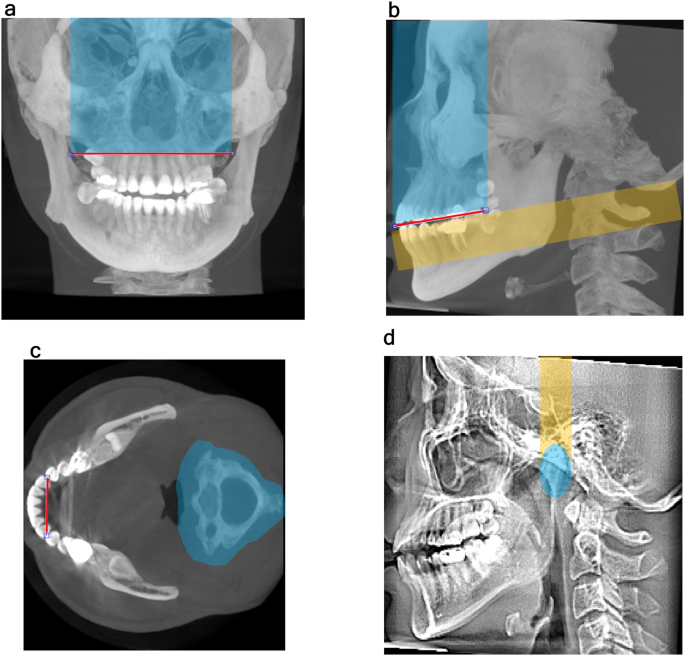
In the coronal maximum intensity projection (MIP) image, after manually selecting 2 points that met both rami passing through the root apex of the maxillary central incisor, the area superior to the line connecting the 2 points was removed from the entire 3D image (Fig. 3a).
Figure 3 
Removal of disturbing regions and location of the distal contact point of the canine. (a) In the coronal MIP images, after manually selecting 2 points that met both rami past the root apex of the maxillary central incisor, the blue area superior to the line connecting the 2 points was removed from the entire image. (b) In the sagittal MIP image, after manually selecting 2 points that passed through the occlusal plane, the blue area superior to the line connecting the 2 points was removed from the entire image. (c) In axial MIP images from the occlusal plane to 2 cm (mean tooth length) below the occlusal plane, the cervical vertebrae posterior to the mandible were removed from the entire image after being magnified to 1.5 times their original size (blue area). The bilateral distal contact points of the canines were manually selected. (d) In the sagittal average intensity image, the upper portions of the bilateral condyles were positioned and removed using an eclipse measuring 15 mm × 21 mm. MIP, maximum intensity projection.
- b.
Removal of the anterior facial bone (sagittal direction).
In the sagittal MIP image, after manually selecting 2 points passing through the occlusal plane (the anterior point was the edge of the first incisor and the posterior point was the posterior margin of the crown of the second molar), the area superior to the line connecting the 2 points was removed from the entire 3D image (Fig. 3b).
- c.
Removal of the cervical vertebrae (axial direction).
In the axial MIP image from the occlusal plane to 20 mm (average tooth length) below the occlusal plane (in Fig. 3b), the cervical vertebrae were segmented automatically using their location relative to the mandible and magnified to 1.5 times their original size (Fig. 3c). This magnified image was removed from the entire 3D image.
- d.
Removal of the temporal bone superior to the condylar heads.
In the sagittal average intensity projection image, the upper portion of the bilateral condylar heads was positioned and removed using an eclipse measuring 15 mm × 21 mm (Fig. 3d).
- 4)
Location of the distal contact points of the bilateral canines: The bilateral distal contact points of the mandibular canines in the above-described axial MIP image were manually located (Fig. 3c). These contact points were the closest points in the mandible corresponding to the middle of the maxillary canines, which were used as reference points to position the focal trough19.
Binarization
Otsu’s method was used to obtain the threshold for the automatic segmentation of the CT data20,21. This algorithm assumes that the image consists of pixels following a bi-modal histogram (foreground and background pixels), and it then calculates the optimum threshold separating the 2 classes so that their intra-class variance is minimal22. We removed the regions impeding segmentation before the binarization process because CBCT images have some inaccurate gray values that disturb the bi-modal distribution of the soft tissue and bone23.
We also used a new algorithm for cumulative binarization (Fig. 4), which summed the 3 previous results to optimize the binarization process. This summed image was used as a mask by being magnified to 1.2 times its original size and applied to the current slice, which was followed by the binarization process using Otsu’s method. This led to better stability than can be obtained using direct binarization of each slice because this algorithm refers to previous anatomic structures that continue smoothly into the current slice.
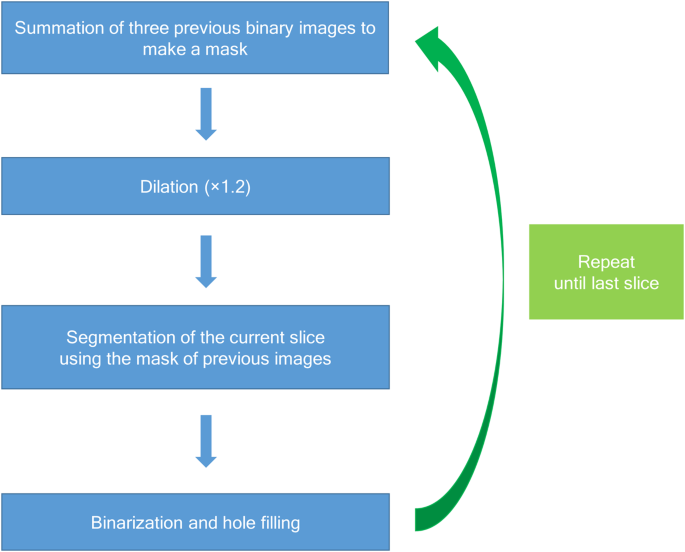
A cumulative binarization algorithm for mandible segmentation. This algorithm summed the 3 previous binarization images to create a mask for the segmentation of the current slice.
The 3D images (Fig. 5a) were binarized (Fig. 5b) until reaching the upper points of the condylar head obtained in the previous step of removing the upper portion of the bilateral condylar heads (Fig. 3d).
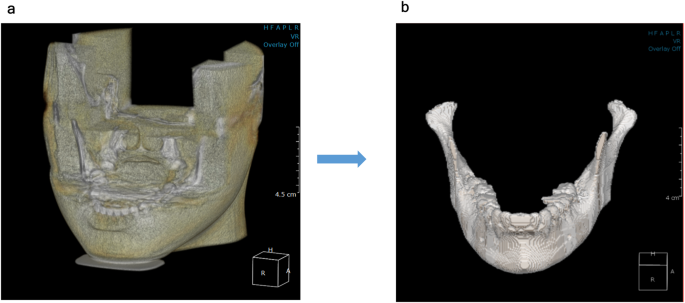
Binarization of the mandible. (a) Representation of the processed 3D CBCT image. (b) The 3D images were binarized using Otsu’s method and the cumulative binarization algorithm until reaching the upper points of the condylar head obtained in the previous step of removing the upper portion of the bilateral condylar heads (Fig. 3d). 3D, 3-dimensional; CBCT, cone-beam computed tomography.
Obtaining the average arch shape by superimposing the segmented images
- 1)
Arch generation in the axial direction:
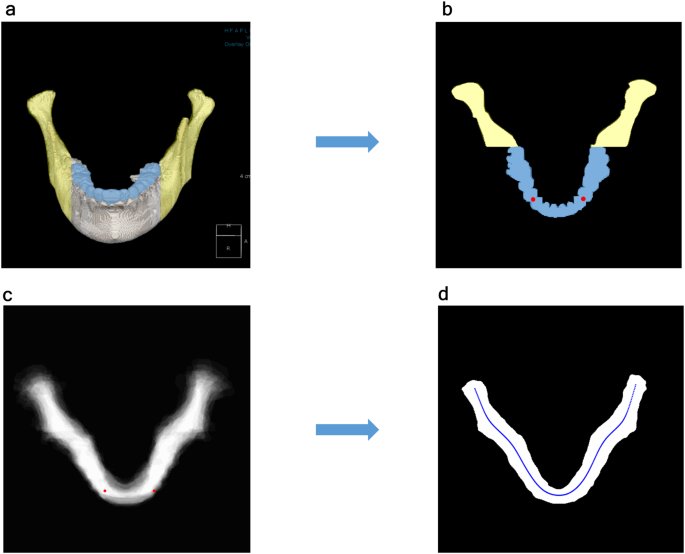
Because the focal trough of the available panoramic machines showed a transition between the dental arch and the more laterally positioned ascending ramus8,9,15,24, the segmented 3D images (Fig. 6a) were projected in the axial direction using the MIP by selecting the dental arch and the posterior mandible containing the ramus and condyle (Fig. 6b). Only the object with maximum size was left in case the temporal bone was included in the result.
Figure 6 
The process of obtaining the average arch model using the segmented 3D image. (a) Segmented 3D mandible. (b) Axial MIP image created by selecting the dental arch and the posterior mandible containing the ramus and condyle in the segmented 3D image. The yellow area represents the ramus and condyle, whereas the blue area represents the dental arch. (c) Thirty MIP images were superimposed on the center of the bilateral distal contact points of the canines (red points). (d) The added images were binarized using a threshold value of 0.47 to obtain the average arch shape. A central line represents the center of the average arch shape. 3D, 3-dimensional; MIP, maximum intensity projection.
- 2)
Composite portraiture of 30 patients’ mandibular arches:
Thirty MIP images were superimposed on the center of the bilateral distal contact points of the canines (Fig. 6c).
The added images were binarized using a threshold value of 0.49, which gave the closest result to the average area (2413.30 mm2) of 30 arches, to obtain the average arch shape (Fig. 6d). This threshold will become closer to the average threshold value of 0.5 as more data are used.
Deriving the center, boundaries, and minimum thickness of the focal trough
The curve fitting procedure was performed automatically by fitting smoothing splines after averaging the right and left side of the curves. This averaging procedure is needed because the panoramic focal trough has a symmetrical shape.
- 1)
Center of the focal trough:
The center of the focal trough (solid curve in Fig. 7a) was obtained by fitting a curve to the center (solid line in Fig. 6d) of the average arch shape.
- 2)
Boundaries of the focal trough:
The boundaries of the focal trough (Fig. 7a) were obtained by fitting curves to each buccal and lingual edges of the average arch shape.
- 3)
Minimum focal trough thickness:
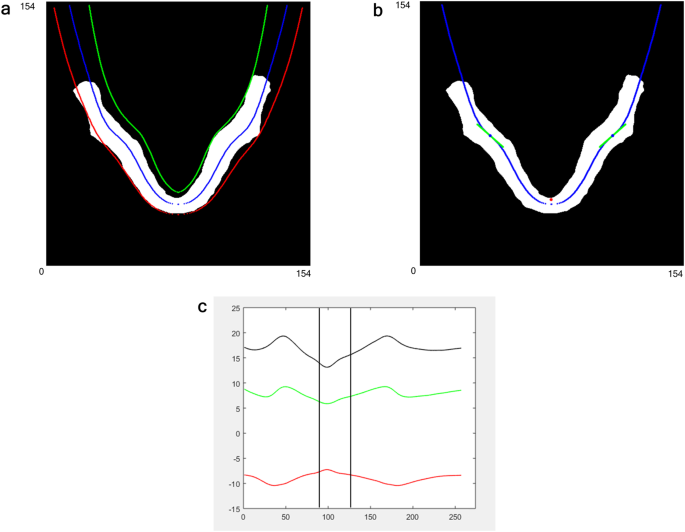
Center, boundaries, and minimum thickness of the panoramic focal trough. (a) The fitted center and boundaries of the focal trough using the average arch shape. Each blue, red, and green curve represents the center, buccal, and lingual boundaries of the focal trough, respectively. (b) The location (blue points) and slope (green segments) of the transition were obtained using the second and first derivatives of the center of the focal trough, respectively. The red point represents the center of the bilateral contact points of the canines. (c) Buccal and lingual boundaries of the focal trough were stretched for the central of the focal trough to become a straight line for obtaining the minimum focal trough thickness. The range of the x-axis is the length of the mandible. The black curve represents the distance (thickness) between the 2 boundaries. Two black vertical lines represent the position of the distal contact points of the bilateral canines. Unit: mm.
The buccal and lingual boundaries of the focal trough were stretched for the center of the focal trough to become a straight line in order to obtain the focal trough thickness (Fig. 7b). This thickness can be thought of as a minimum, because it contains the border of the average arch shape, and recent panoramic machines have a wider focal trough than the average arch8,9.
Obtaining the location and gradient of the transition between the dental arch and the ramus
To conceptualize the transition between the dental arch and the ramus, the location and slope of the transition were defined. The location and slope of the transition were obtained using the second and first derivatives of the center of the focal trough, respectively.
Statistical analysis
To validate the automatic segmentation algorithm, the mandibles were manually segmented and transferred to STL (standard triangulated language) using the OnDemand 3D application (Cybermed, CA, USA) by one radiologist. The STL files were registered to automatic segmentation results using the intensity based ‘imregister’ function of MATLAB (‘multimodal’, ‘InitialRadius = default/3.5, ‘MaximumIterations’ = 300) because the transferred STL files have no dimensional information. Both segmentation results were compared using dice coefficients25. The intraclass correlation coefficients (ICCs) of the intra and inter-examiner were used to evaluate the coordinates for removing the facial bone and upper portion of the condylar heads, and to locate the distal contact points of the bilateral canines. Dice coefficients were also calculated to evaluate the similarity of the segmented arches between the repeated experiments.


