Datasets and image preparation
This study was approved by the Institutional Review Board (IRB) of Yonsei University Dental Hospital (NO. 2-2021-0059) and was conducted in accordance with relevant guidelines and ethical regulations. As a retrospective study, the requirement of patient informed consent was waived by the IRB of Yonsei University Dental Hospital. The data were anonymized to avoid identification of the patients.
In total, 19,350 CBCT images were acquired from 90 maxillary sinuses of 45 patients (26 females and 19 males) who visited Yonsei University Dental Hospital from June 2020 to March 2021. There were 430 images per person, and the number of images including the sinus varied from 156 to 215. All CBCT data were acquired with a 16 × 10 cm field of view using a RAYSCAN Alpha Plus device (Ray Co. Ltd, Hwaseong-si, Korea). Cases with abnormalities or a history of surgery in the maxillary sinus were excluded, as were poor-quality images with artifacts. The 90 maxillary sinuses were clear or had various states of haziness, including mucosal thickening, mucous retention cysts, and fluid (Fig. 1). The datasets for training, validation, and testing were split into 6:2:2 ratios27,28. The characteristics of the subjects are summarized in Table 1.

Examples of various maxillary sinus images. (a) Clear sinuses (both sides), (b) a slightly hazy sinus (left side), (c) a moderately hazy sinus (right side), (d) a severely hazy sinus (left side).
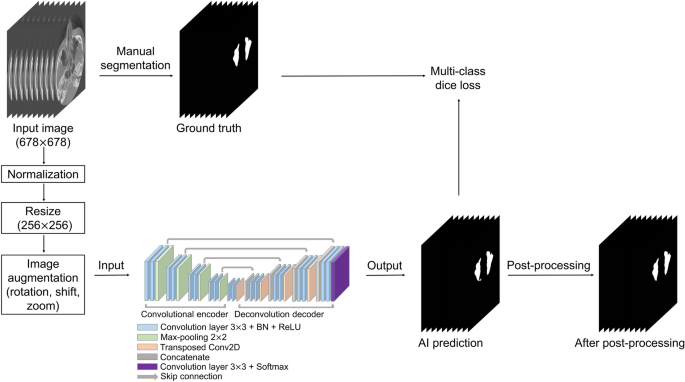
CBCT data were used in the Digital Imaging and Communications in Medicine (DICOM) format with a matrix size of 678 (width) × 678 (height) pixels. To generate a label mask for the ground truth, an oral radiologist with over 20 years of experience conducted manual segmentation of the maxillary sinus in each axial image using 3D Slicer (free open-source software for biomedical image analysis)29. The label images were exported in the DICOM format and used as the ground truth for network training. Input images of 678 × 678 pixels were normalized by using two-dimensional min/max normalization and resized to 256 × 256 pixels. Data augmentation was performed with rotation (− 5° to 5°), translation shift (0–30%), and zoom (0–30%). Figure 2 shows the overall process.

Overall process of our study.
Network architecture
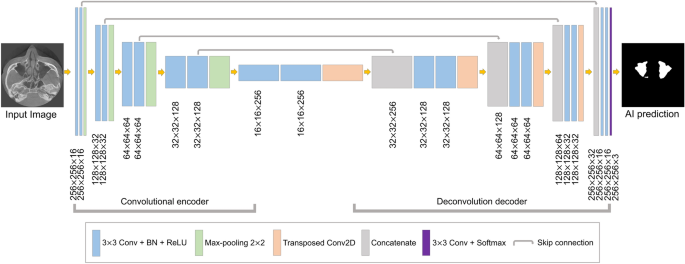
The segmentation model based on U-Net was designed for maxillary sinus segmentation. The U-Net model has demonstrated powerful performance in the segmentation of medical images24,25,26. This architecture is shown in Fig. 3. It consisted of a fully convolutional encoder and decoder, including 18 convolutional blocks, 4 max-pooling layers, 4 transposed convolution layers, and output layer. The convolutional block consisted of a 3 × 3 convolution with stride 1, batch normalization, and the ReLU activation function. At the end of the network, the softmax activation function in the output layer was used for multi-class segmentation of the background, right maxillary sinus, and left maxillary sinus. In the encoding block, the U-Net extracted the maxillary sinus features and passed them on to the next block. In the decoding block, the spatial information features were extracted, and then the size of feature maps was recovered to be the same as the input. The deep learning networks were implemented in Python 3 with the Keras library and trained on an NVIDIA Titan RTX (24 GB).

Structure of U-Net based convolutional neural network segmentation.
Loss function
For training, the Adam optimizer30 was applied, and the learning rate was initially set to 10−3. While monitoring the loss of the validation set, if the validation loss did not decrease for 20 epochs, the training was stopped using an early stopper. The loss function of a deep learning network is calculated for validating the quantitative difference between the network output and ground truth. The network parameters are iteratively adjusted in the training phase to minimize loss. In order to train the proposed model, we employed the Dice coefficient28–based multi-class loss function (DL). The DL is defined as:
$$mathrm{DL}left(mathrm{P},mathrm{G}right)=1-frac{1}{K}sum_{c=1}^{K}frac{2sum_{i}^{N}{p}_{i}^{c}{g}_{i}^{c}}{sum_{i}^{N}{p}_{i}^{c}+sum_{i}^{N}{g}_{i}^{c}}$$
(1)
where ({p}_{i}) and ({g}_{i}) represent the pixel values of prediction and ground truth, respectively, N is the number of pixels, and K is the number of classes (background, right maxillary sinus, and left maxillary sinus).
Post-processing
Post-processing was performed to reduce the prediction errors of the developed U-Net model. If the maxillary sinus is adjacent to an air area such as the ethmoid sinus or connected to the airway, it tends to be incorrectly predicted. This intrinsic limitation of neural networks can lead to pixel-level prediction errors31, especially at maxillary sinus boundaries. To solve these problems, we conducted post-processing to eliminate false positives in the maxillary sinus segmentation results of the U-Net (Fig. 4). A 3D volume of the maxillary sinus can be obtained by stacking 2D slice images, and volume information can be acquired by using a connection component of a voxel. Background voxels are labeled with 0, and voxels of the maxillary sinus region are labeled with 1. Labels of 1 for small volumes not connected to the maxillary sinus were removed. Then, the 3D volumetric image was converted to 2D images. This method was implemented using MATLAB 2021a (MathWorks, Natick, MA, USA).

The post-processing workflow. False positives not connected to the maxillary sinus were eliminated.
Evaluation metrics
We used the dice similarity coefficient (DSC), precision, recall, and Hausdorff distance (HD)32 to evaluate the artificial intelligence (AI) prediction results and post-processing results. The DSC is the most frequently used evaluation method in medical image segmentation to compare a segmentation result R and the ground truth result G. The formula of the DSC is defined as:
$$mathrm{DSC}=frac{{2}left|mathrm{R}cap mathrm{G}right|}{left|{text{R}}right|+left|{text{G}}right|}$$
(2)
To evaluate the segmentation quality, we used the precision and recall, which are defined as:
$$mathrm{Precision}=frac{text{TP}}{{{rm TP}} + {text{FP}}}$$
(3)
$$mathrm{Recall}=frac{text{TP}}{{{rm TP}} , + , {text{FN}}}$$
(4)
where TP, FP, and FN are true positive, false positive, and false negative, respectively. TP represents the number of pixels for which the maxillary sinus areas were accurately predicted. FP represents the number of pixels that were not maxillary sinus areas but were predicted to be maxillary sinuses. FN represents the number of unpredicted pixels in the maxillary sinus areas.
The HD measures the degree of difference between the two results by considering the spatial distance between the segmented objects as an index33. The closer the HD value is to 0, the more similar the prediction result is to the ground truth. The HD measures the maximum distance between two point sets, X and Y. The HD is defined as:
$${text{HD}}(mathrm{X},mathrm{Y})=maxleft(underset{xin X}{{max}},underset{yin Y}{{min}},dleft(x,yright),underset{xin Y}{{max}},underset{yin X}{{min}},dleft(x,yright)right)$$
(5)
where (x) and (y) denote two points between the ground truth and prediction result of the maxillary sinuses, and (dleft(x,yright)) is the distance between the two points.

