Ethics
This study was approved by the institutional review board (IRB No. 2-2021-0027) of Yonsei University Dental Hospital and was conducted and completed in accordance with the ethical regulations. Due to the retrospective nature of the study, the requirement for informed consent was waived and this was approved by Yonsei University Dental Hospital, IRB. All imaging data were anonymized before export.
Data collection
For this study, 21 patients who underwent both CBCT and MRI for temporomandibular joint (TMJ) disease in our institution were randomly selected and examined. The CBCT-MRI paired data set was randomly divided into training (n = 16) and test (n = 5) sets.
All CBCT images were obtained with an Alphard 3030 unit (Asahi Roentgen, Kyoto, Japan) using the following parameters: tube voltage, 90 kVp; tube current, 8 mA; exposure time, 17 s; field of view (FOV), 150 × 150 mm; and voxel size, 0.3 mm. There was no modification on the reconstruction filter from the projection into the axial image data and the default parameters provided by the manufacturer were used in this study.
MRI was performed using the 3.0 T scanner (Pioneer; GE Healthcare, Waukesha, WI, USA) with a 21-channel head coil. Isotropic three-dimensional zero echo time (ZTE) sequences were acquired with the following parameters: TE/TR, 0/785 ms; flip angle, 4°; receiver bandwidth, 31.25 kHz; number of excitations (NEX), 2; FOV, 180 × 180 mm (supra-orbital rim to upper neck region); acquisition matrix, 260 × 260; voxel size, 0.35 mm; slice thickness, 1.0 mm; and scan time, ~ 5 min.
Data preparation
Paired image data were registered due to differences in patient orientation during image acquisition. The entire registration process was conducted via ITK-snap (ver. 3.0, www.itksnap.org). The gross orientation of MRI (anterior–posterior position) was matched with CBCT orientation (superior-inferior position) manually. Then, based on the mutual information, geometrical rigid registration was conducted until the mutual information between the two images reached its maximum16.
Then, the MRI image was resliced into the same thickness, 300 (upmu)m, as the CBCT image. Five hundred and twelve CBCT and MRI axial slides were prepared. For data augmentation, axial image data were reconstructed into 512 coronal and sagittal slides each, and all images were prepared in the BMP format. In total, 64,512 images (3,072 images per data pair) of CBCT and MRI data were prepared.
Deep learning network training
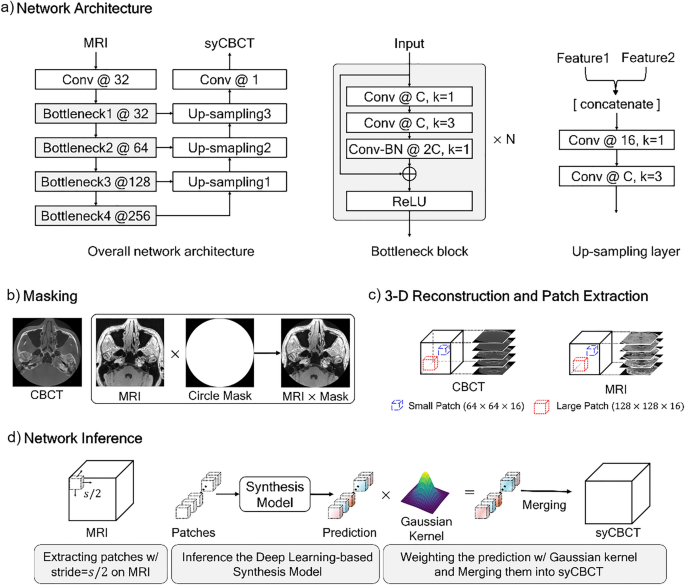
A modified U-Net structure was used for our synthesis model. U-Net is commonly applied to biomedical imaging tasks, as it shows relatively higher accuracy than existing networks with a small number of source images17. To enhance the result performance by extracting more hierarchical features than those of the original U-Net, we modified several parts of the network structure as illustrated in Fig. 1. First, the encoder structure was substituted with the Bottleneck blocks of ResNet-5018, and all 2-dimensional convolution layers were changed into 3-dimensional convolution layers. Second, the last skip connection of the U-Net was removed because the minute registration error between MRI and CBCT makes the morphology of synthesized prediction confusing, and the different patterns of the input MRI can affect the results. Lastly, to prevent the model capacity from exceeding our hardware memory size, the number of convolution kernels was changed, as described in Fig. 1a. The ablation studies for each proposed component were performed.

The overall network training and inference process. (a) Our network architecture. Conv denotes the kernel series of [Convolution-Batch Normalization (BN) -Rectified Liner Unit (ReLU)], N indicates the number of repeated bottleneck blocks, the number after the symbol @ represents the number of kernels, and k denotes the kernel size. (b) The MRI and CBCT are multiplied by a circle mask at the pixel level. (c) Large or small patches are extracted from the 3-dimensional reconstructed image. (d) An input MRI is partitioned into sub-patches, and then predictions of the trained network are weighted by the Gaussian kernel.
Sixteen sets of MRI-CBCT pairs were used for training the synthesis model, and five sets were evaluated as test sets. For pre-processing, we multiplied the MRI-CBCT pair by a circle binary mask with a radius of 256 pixels to remove the background noise (Fig. 1b). Then, the masked images were stacked in the vertical direction to reconstruct a 3-D image of size 512 × 512 × 512. Due to different field of view size, peripheral area loss occurs in specific images of MRI and CBCT sequences. The noisy sequences were excluded in the training step to ensure stable network training. We used only 21–490, 1–360, and 41–380 sequences for the x, y, and z axes of the entire image, respectively. To overcome the limitation of the hardware (memory size) and execute the data augmentation, we randomly extracted patches from the whole image. The experiments were conducted with two different sizes of patches; a large patch of size 128 × 128 × 16 and a small patch of size 64 × 64 × 16, as illustrated in Fig. 1c.
The network was trained by Adam optimizer with an initial learning rate of 2.5 × ({10}^{-4}), that was exponentially decayed by 0.8 every 200 iterations, and the weight decay was 10–5. The smooth L1 loss and the early stopping method were used with a stopping factor of 5. The mini-batch sizes were 32 and 8 for the small and large patches, respectively. The input patches were normalized to [− 1, 1].
In the inference phase, an input MRI image was partitioned into the patches using a sliding window method, with the step size being half the patch size (Fig. 1d). The trained synthesis model predicted the CBCT patches. Then, each patch was weighted by the Gaussian filter to generate a smooth cross-section of 3-D synthetic CBCT (syCBCT). Finally, the syCBCT was merged by overlaying weighted patches with the same stride of the sliding window.
Accuracy assessment and clinical validation
Three-dimensional model surface deviation
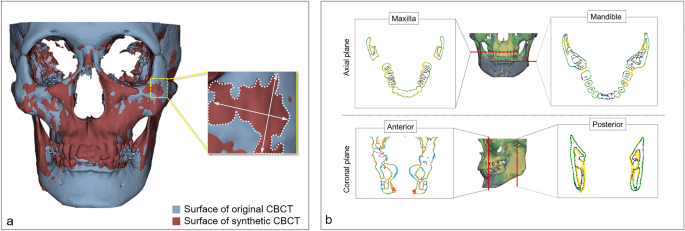
A three-dimensional maxillofacial model was generated in the STL format based on both original CBCT and syCBCT. The two models were superimposed for measurement using Geomagic Control X (3D Systems, Cary, NC, USA). Then, the overall surface deviation was acquired (Fig. 2a) for both large and small patches based on syCBCT. The surface deviation of syCBCT was also obtained for anatomical regions, maxilla, and mandible in the axial and anterior–posterior coronal planes (Fig. 2b). The reference planes were determined by following a previous study19. The axial plane was determined by the cement o-enamel junction of the upper and lower teeth. Anatomical landmarks, including mental foramen (anterior) and mandibular foramen (posterior), were used to determine the coronal plane. All measured deviation values were obtained in root mean square (RMS, mm).

Surface deviation of synthetic CBCT. (a) The deviation of the overall three-dimensional model. (b) The deviation measurement in axial (maxilla and mandible) and coronal (anterior and posterior) planes. The black line indicates the surface of the original CBCT, and the colored line indicates deviated area. CBCT, cone-beam computed tomography; syCBCT, synthetic CBCT.
Expert image quality evaluation
Two radiologists with more than 10 years of experience conducted a subjective evaluation using the modified version of the clinical image evaluation chart of CBCT provided by the Korean Academy of Oral and Maxillofacial Radiology (Table 1). The clinical image evaluation chart comprises 4 sections: artifact, noise, resolution, and overall image. In the artifact, noise, and resolution sections, the evaluator graded image series as poor, moderate, or good. For overall grade, the possible outcomes were: no diagnostic value, poor, moderate, or good.
Image quality evaluation metrics
For five sets of test data, the image quality of the syCBCT in axial series was compared to that of the original CBCT image using three indices, mean absolute error (MAE), peak signal-to-noise ratio (PSNR), and structural similarity indexing method (SSIM), that are frequently used to evaluate synthetic images20. MAE suggests a correlation with the image noise level, PSNR is closely related to the clarity and resolution of the image, and SSIM is comprehensively correlated with the structural similarity of the synthetic image. The definition and ideal reference value18 of each index were as follows:
$$MAE = frac{1}{N}mathop sum limits_{i = 1}^{N} left| {syCT_{i} – CT_{i} } right|,;{text{reference}};{text{value}} = 0;{text{HU}}$$
(1)
$$PSNR = 10 times {text{log}}left( {frac{{f_{max}^{2} }}{{rmse^{2} }}} right),;{text{reference}};{text{value}} > {25};{text{dB}}$$
(2)
$$SSIM = frac{{left( {2mu_{{hat{y}_{i} }} mu_{{y_{i,k} }} + c_{1} } right)left( {2sigma_{{hat{y}_{i} y_{i,k} }} + c_{2} } right)}}{{left( {mu_{{hat{y}_{i} }}^{2} + mu_{{y_{i,k} }}^{2} + c_{1} } right)left( {sigma_{{hat{y}_{i} }}^{2} + sigma_{{y_{i,k} }}^{2} + c_{2} } right)}},;{text{reference}};{text{value}} = {1}$$
(3)
All metrics were obtained according to the ability to present hard tissue, soft tissue, and air in syCBCT compared to the original CBCT20.
Statistical analysis and comparisons
To measure the surface deviation of large and small patch-based 3-D models, RMS values were compared using the Mann–Whitney test. The deviation at the anatomical regions (maxilla, mandible, posterior, and anterior) was compared using the Kruskal–Wallis test and Dunn’s multiple comparison post-hoc test. The number of grades from the clinical CBCT image evaluation chart according to each criterion (artifact, noise, resolution, and overall) was also assessed for original CBCT and syCBCT images. Inter-observer agreement was obtained by interclass correlation coefficient (ICC). The image quality metrics, MAE, PSNR, and SSIM, were compared for hard and soft tissue as well as air in individual syCBCT using one-way ANOVA. Statistical analysis was conducted with GraphPad Prism version 9.4.1 (GraphPad Software, La Jolla, CA, USA, www.graphpad.com) and a confidential interval of 95%.

