Study Selection
A literature search was performed through electronic databases: Ovid, PubMed, Web of Science, and Cochrane Library and yielded 67 articles. In addition, hand searching through relevant journals and reviews resulted in 40 additional articles. The titles of the identified studies were reviewed, and 26 duplicates were excluded. Then, the abstracts and full text of the remaining 81 abstracts were independently reviewed by two investigators (Trieu and Mohamed) to determine whether an individual study was eligible for full text qualitative and quantitative analyses in this systematic review. The inclusion criteria were as follows: (1) cohort or case-control or controlled or randomized control study designs (2) included the previously mentioned key words (3) only articles published in English and (4) studies performed in humans. The exclusion criteria were as follows: (1) non-English articles (2) in vitro studies (3) narrative reviews and (4) expert opinions (5) enamel caries (6) adults greater than 12 years old. For detailed information on inclusion and exclusion criteria, please refer to Table 1. Disagreements among the two investigators were resolved by a third independent reviewer (Lynch). As a result, 75 articles were excluded as per the exclusion criteria and the remaining six articles were then subjected to full-text qualitative and quantitative analyses. Please refer to Fig. 1 for detailed information on study selection process.
Flow diagram of study selection process.
Study characteristics
Through the literature search, six articles met inclusion criteria. They were published between 2001 and 2018 and included four randomized controlled trials (RCT)12,13,14,15 and two studies which were secondary statistical analyses of RCTs16,17. However, the four identified RCTs consist of two individual studies (Lo et al.14 and Duangthip et al.13), while the remaining two RCTs were their follow-up articles reporting results at later time points (Chu et al.15 and Duangthip et al.12).
The included studies recruited a total of 746 pre-school children with a mean age of 3.4 years12,13 and 4.0 years14,15. The RCT by Duangthip et al.13 and its follow-up article (Duangthip et al.12) reported sample size calculations12,13, while the other RCT and its follow-up article did not14,15. Dropout rates were recorded in all articles.
Of the studies, the RCT by Lo et al.14 and its follow-up article focused on carious lesions of upper anterior primary teeth only14,15, while the other RCT by Duangthip et al.13 and its follow-up article included both anterior and posterior primary teeth12,13. Lo et al.14 and its follow-up article used 38% SDF14,15, while Duangthip et al.13 and its follow-up article used 30% SDF, but all RCTs compared the SDF intervention to 5% NaF varnish. All RCTs utilized the decayed, missing, and filled surfaces (DMFS) protocol to record outcomes by tactile examination. Lesions were classified as active caries or arrested caries using sharp sickled probes14,15 or ball ended probes12,13. Oral hygiene (OH) at home was evaluated by parental questionnaire in all RCTs, and clinically examined and recorded by using a visible plaque index (VPI) in one RCT and its follow-up article12,13. In addition to DMFS, demographic background (gender, age) and oral health related behaviours (frequency of tooth brushing, use of fluoride toothpaste, snacking habits, location of treated caries lesion, presence of plaque on lesion) were included in the statistical analysis12,13. Inter-examiner variability was measured and kappa statistics were completed in all RCTs for examiner discrepancies.
Study findings and outcomes
In Duangthip et al.13, three treatment groups were established to compare dentine caries arrest between SDF and NaF by employing varying application intervals (annual and 3 weekly applications) and examination time points at 6 months (m), 12 m, 18 m. Caries arrest rate was significantly higher in the SDF groups (annual and 3 weekly applications) compared to NaF (3 weekly applications) (p < 0.001, CI 95%). Duangthip et al.12 extended the latter study by adding examination time points at 24 m and 30 m. At 30 m, Duangthip et al.12 reported the caries arrest rate of Group 1 (annual SDF application) to be significantly higher than both Group 2 (3 weekly SDF application) and Group 3 (3 weekly NaF application) (p < 0.001).
Lo et al.14 found a statistically significant difference in caries arrest rate by SDF over that of NaF or water (p < 0.001). Chu et al.15 furthered the study to 30 m and found SDF groups arrested caries better than all other groups (p < 0.001) and with more arrested lesions appearing black than other groups (p < 0.001), but parental satisfaction with their child’s dental appearance and dental health did not significantly change (p < 0.05). Chu et al.15 found that soft caries removal.
Prior to SDF application did not induce a significant difference in the caries arrest rate when compared to SDF application without excavation (C.I. 95%).
Wong et al.17 and Wong et al.16 conducted secondary statistical analyses (Bayesian and multivariant model, respectively) on previously collected data in RCTs by Chu et al.15 and Lo et al.14. Wong et al.16 found that SDF resulted in a shorter arrest time than NaF. Wong et al.17 applied the Bayesian model and found that soft caries excavation resulted in a shorter caries arrest time than no excavation, and that SDF induced caries arrest time was reduced compared to NaF.
The details of all the included studies are shown in Table 2.
Quality assessment
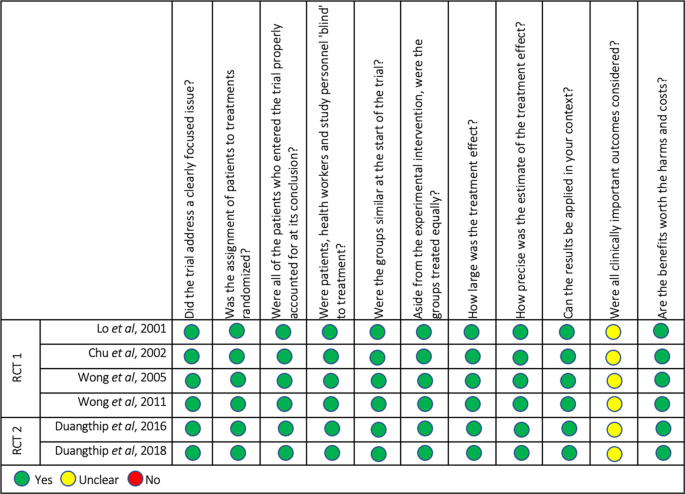
All RCTs developed PICO formulated question(s) involving caries arrest by the use of SDF intervention compared to NaF. Sample size calculations were performed in Duangthip et al.13 (and also reported in the follow-up article Duangthip et al.12), but were not performed in Lo et al.14 or any of its follow-up articles. Patients were allocated into groups by stratified block randomization in Duangthip et al.13 and Duangthip et al.12, while Chu et al.15 and Lo et al.14 utilized sequential allocation. All RCTs utilised blinding protocols. While the study by Duangthip et al.13 and its follow- up article (Duangthip et al.12) adopted a triple blind protocol where the treatment providers, sole examiner and participants were blind to the intervention/control, the study by Lo et al.14 and its follow-up article (Chu et al.15) employed a double blind protocol where an independent examiner was recruited in the study. However, due to the difference in physical appearance between intervention and comparison reagents, patients, providers and/or examiners were likely able to distinguish between the intervention and comparison reagents. Otherwise, all groups were treated equally during the treatment time including the number of exams and/or treatment visits each group attended.
Clinically important outcomes were recorded and statistical analyses were conducted. Dropouts were reported in all articles. Lo et al.14 and its follow-up article (Chu et al.15) reported no statistically significant differences in the number of non-vital teeth among the five treatment groups, while Duangthip et al.13 and its follow-up article (Duangthip et al.12) reported drop out by true failure to follow up or had moved, number of teeth needing restorative treatment, and exfoliation. Duangthip et al.12 found no significant difference between all groups regarding prevalence of non-vital teeth in the International Caries Detection and Assessment System (ICDAS) 3–4 (p > 0.05). Benefits, harms, and costs regarding treatment agents were discussed in all RCTs. The overall inter-examiner variability was 92.4% for the six included studies. High concordance was observed, signifying high reproducibility between the two examiners. The details of all the included studies are shown in Fig. 2.

Quality assessment of the included studies by CASP tool. Summary review of the qualitative assessment of the included studies by using CASP tools for randomised controlled trials (RCTs) consisting of 11 quality criteria. Green-coded circle indicates that the study satisfactorily met the respective quality criterion, yellow-coded circle indicates that the study partially met the respective quality criterion, and the red-coded circle indicates that the study did not meet the respective quality criterion.
Statistical meta-analysis
Two meta-analyses were conducted, encompassing: Lo et al.14, Chu et al.15, Duangthip et al.13 and Duangthip et al.12. In meta-analysis 1, arrested caries by treatment group were analyzed in the 18 m trials of Lo14 and Duangthip et al.13, while meta-analysis 2 compared the 30 m results12,15.
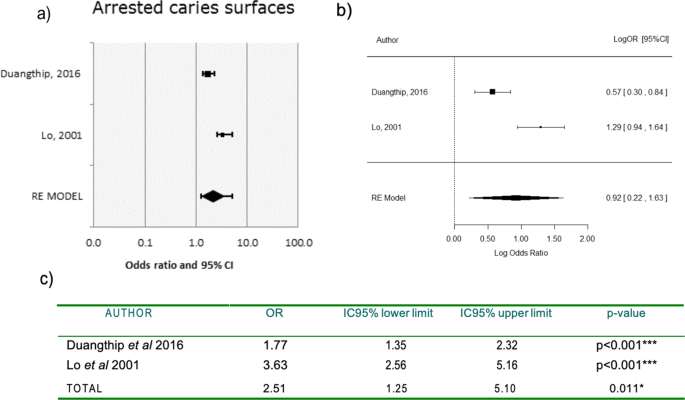
Data between studies was harmonized to determine the odd ratio (OR). Individual estimated ORs and the pooled ORs were generated and revealed a significant increased probability of SDF arresting caries as compared to NaF at both 18 m (OR = 2.51, 95% CI:1.2,5.10, p = 0.011) and 30 m (OR = 2.03, 95% CI: 1.5,2.77, p < 0.001). Please see Figs 3 and 4.

Forest and logarithmic plots for pooled ORs of arrested carious surfaces (meta-analysis 1, 18 m). Forest plot for pooled ORs of arrested caries surfaces at 18 m. (a) Duangthip et al.13 reported OR = 1.77, interpreting that SDF increased the probability of arresting active caries on surfaces at 77% compared to NaF, which is higher (p < 0.001). Lo et al.14 reported OR = 3.63 >1, favoring SDF (p < 0.001). Taken into consideration that OR = 1 is the reference level whereby no effect is assigned to the test treatment SDF. OR >1 means an increment of arrested caries rate in the SDF group compared to control NaF. OR < 1 means a reduction of arrested caries rate in the SDF group compared to control NaF. Logarithmic measure for pooled ORs of arrested caries surfaces at 18 m. (b) Taking into consideration logarithmic focus provides symmetrical confidence intervals. Log(OR) = 0 is the reference level: no effect is assigned to the SDF treatment. Log (OR) >0 means an increment of arrested caries rate in the SDF group compared to control NaF. Log (OR) <0 means a reduction of arrested caries rate in the SDF group compared to control NaF.

Forest and logarithmic plots for pooled ORs of arrested carious surfaces (meta-analysis 2, 30 m). Forest plot for pooled ORs of arrested caries surfaces at 30 m. (a) Duangthip et al.13 reported OR = 1.79, interpreting that SDF increased the probability of arresting active caries on surfaces at 79% compared to NaF, which is higher (p < 0.001). Chu et al.15 reported OR = 2.44 > 1, favoring SDF (p < 0.001). Taken into consideration that OR = 1 is the reference level whereby no effect is assigned to the test treatment SDF. OR >1 means an increment of arrested caries rate in the SDF group compared to control NaF. OR <1 means a reduction of arrested caries rate in the SDF group compared to control NaF. Logarithmic measure for pooled ORs of arrested caries surfaces 30 m. Taken into consideration logarithmic focus provides symmetrical confidence intervals. Log(OR) = 0 is the reference level: no effect is assigned to the SDF treatment. Log (OR) >0 means an increment of arrested caries rate in the SDF group compared to control NaF. Log (OR) <0 means a reduction of arrested caries rate in the SDF group compared to control NaF.
Heterogeneity analysis
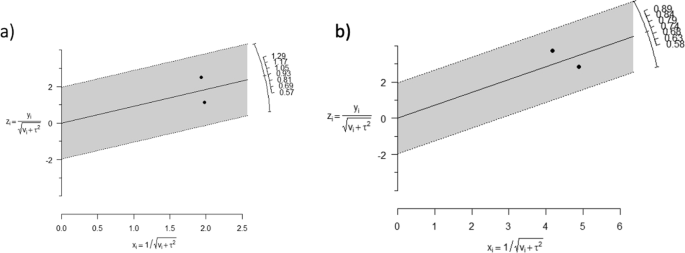
Heterogeneity was evaluated with Cochran’s Q Test and the I2 Index. A higher level of heterogeneity was found at 18 m (I2 = 90.3, Q = 10.29, p = 0.001) than at 30 m (I2 = 44.3%, Q = 1.79; p = 0.180). Galbraith graphs (See Fig. 5) were also generated to establish heterogeneity of the meta-analyses. Both meta-analysis 1 and meta-analysis 2 fell within confidence levels suggesting distance but lay within the confidence intervals.

Galbraith graphs for analysis of heterogeneity. Galbraith graphs for heterogeneity analysis at (a) 18 m (I2 = 90.3, Q = 10.29, p = 0.001), both studies are distanced but between the confidence levels and (b) 30 m (I2 = 44.3%, Q = 1.79; p = 0.180), both studies are distanced but between the confidence levels. Taken into consideration the horizontal axis corresponds to precision of the study and the vertical axis to standardized effect. The arch shows ln(OR) and the central line is the global effect measure.
Potential publication bias
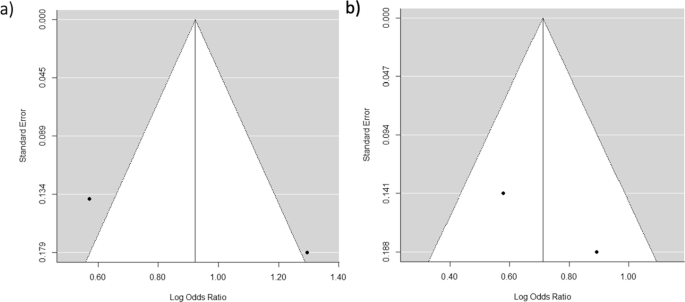
Publication bias was evaluated with funnel graphs (See Fig. 6). Duangthip et al.13 and Duangthip et al.12 reported a larger sample size and thus increased precision, but both meta-analysis 1 and meta-analysis 2 showed acceptable symmetry. No publication bias was detected.

Funnel plots for publication bias. Funnel plots for publication bias at (a)18 m Duangthip et al.13 is vertically higher, exhibiting a higher precision, due to its larger sample size with acceptable symmetry for this precision level and (b) 30 m Duangthip et al.12 is vertically higher, exhibiting a higher precision due to larger sample size. Taken into consideration that an acceptable symmetry at this precision level, there are some articles reporting different effects regarding effectiveness of SDF to NaF.


