An overview of the proposed method is schematically shown in Fig. 1. The first step is to set a dental arch suitable for the patient in the CBCT image (Fig. 1c). The next step is to establish a panoramic scan trajectory based on the set dental arch (Fig. 1d) and acquire virtual panoramic projection data from the CBCT projection data (Fig. 1e). Finally, a panoramic image is reconstructed based on the acquired panoramic projection data (Fig. 1h).
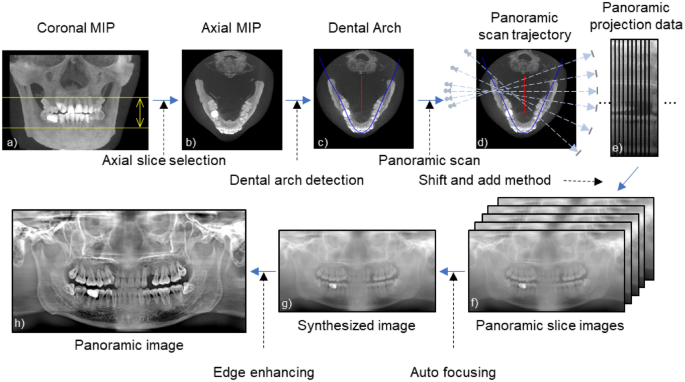
Workflow of the proposed method. (MIP stands for the maximum intensity projection).
Dental arch detection
An algorithm that automatically detects the dental arch from a CBCT image is described in this section. We use the axial maximum intensity projection (MIP) of the CBCT image that can represent the overall structure of the teeth18,23,24,25,26,27,28,29,30. An MIP image of the axial slices within a specified range is desirable for detecting dental arch. To distinguish the jawbone from the teeth in the axial MIP image, the range for generating the axial MIP image must be appropriately chosen18. If the slice range is set too wide, excessive bone tissue is superimposed on the axial MIP image, complicating the detection of the dental arch. On the other hand, there is a possibility that the region of interest may not be included when the slice range is set too narrow. In this work, we automatically determined the slice range using a coronal MIP image.
First, a teeth binary mask (Fig. 2b) is acquired by applying a threshold, that has been empirically determined from the clinical dataset, to the coronal MIP image (Fig. 2a). A histogram that plots the number of positive pixels in each row of the mask image is prepared (Fig. 2c). From the histogram, we define the upper and lower bounds of the teeth in the row axis by thresholding the counts. Next, the axial slice range is set by allowing an additional margin of 20 slices which was also empirically determined in this work (Fig. 2d). Finally, an axial MIP image is obtained from the original CBCT image using the selected axial range (Fig. 2e).
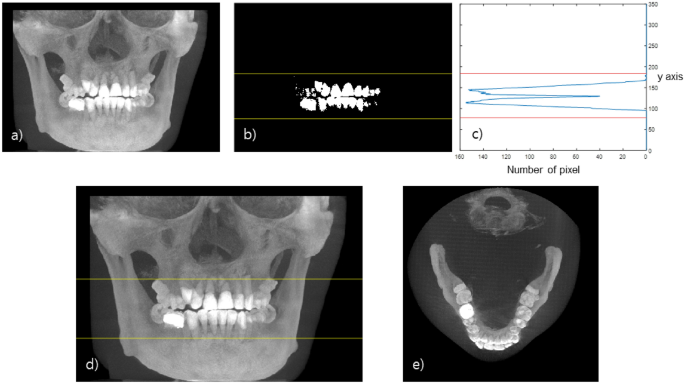
Range of the axial slice containing the teeth. (a) Coronal MIP image, (b) Mask image of teeth. (c) Y-axis histogram of the tooth mask image, (d) Selected range of the axial slice, (e) Axial MIP image.
After acquiring the appropriate axial MIP image, we detect the dental arch based on a parabolic fit in the axial MIP image. The dental arch including the teeth and the jawbone can be obtained by smoothly connecting the parabola representing the teeth and the parabola representing the jawbone as shown in Fig. 3. First, a teeth mask is acquired by applying a threshold to the axial MIP image (Fig. 3b). Then, after dividing the dental mask evenly in the angular direction with respect to the image center, the middle point of the masked teeth within each angular bin is marked as a fitting point. The RANSAC (RANdom Sample Consensus) algorithm was applied to the marked points to come up with the fitting parabola to the teeth31. The jawbone-fitting parabola was obtained by fitting a parabola connecting the marked points of the molar teeth and the tips of the corresponding jawbone (Fig. 3c). Finally, the jawbone-fitting parabola and the teeth-fitting parabola were merged by use of a cosine weighting function near the intersection points to smoothly connect them resulting in the dental arch delineation (Fig. 3d).
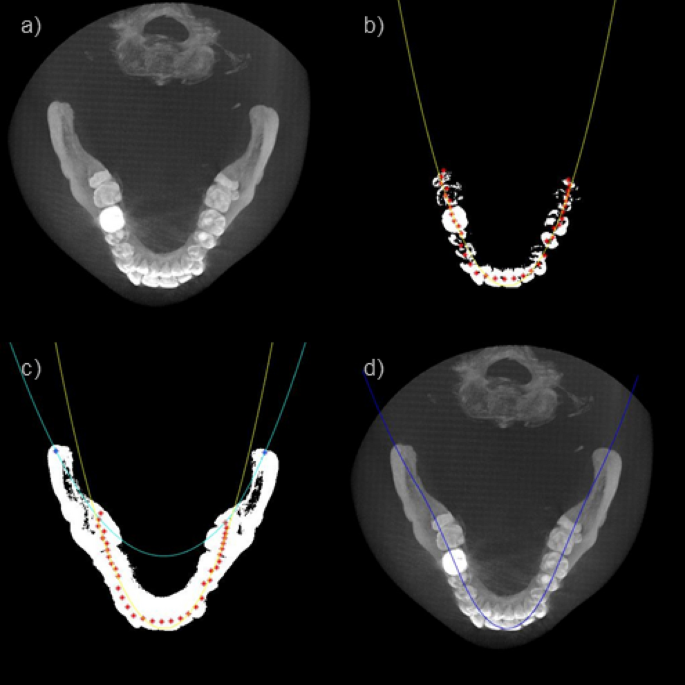
(a) Axial MIP image, (b) Tooth trajectory fitting, (c) Jaw bone trajectory fitting, (d) Dental arch detection.
Panoramic projection data acquisition
After acquiring the appropriate dental arch, the acquired dental arch is used to establish a panoramic scan trajectory. Again, it is noted that the virtual panoramic scan trajectory can be established by shifting the reference panoramic scan trajectory according to the patient’s dental arch. In this study, the manufacturer’s conventional panoramic scanning trajectory was used as the reference trajectory.
There are two major challenges in virtual panoramic imaging as proposed in this work: panoramic projection data synthesis from half-fan cone-beam projection data and intensity nonuniformity compensation over the panoramic FOV. In the following, we address these challenges and remedies one by one.
As shown in Fig. 4a and b, there are some differences between the panoramic scan system and the CBCT scan system. Unlike the panoramic scan system, the dental CBCT scan system uses a wide detector but uses a half-fan detector mode with an offset. In addition, while the rotational axis of the dental CBCT scan system is fixed, the rotational axis of the panoramic scan system moves along a line segment to minimize the overlapping of teeth images during a scan.
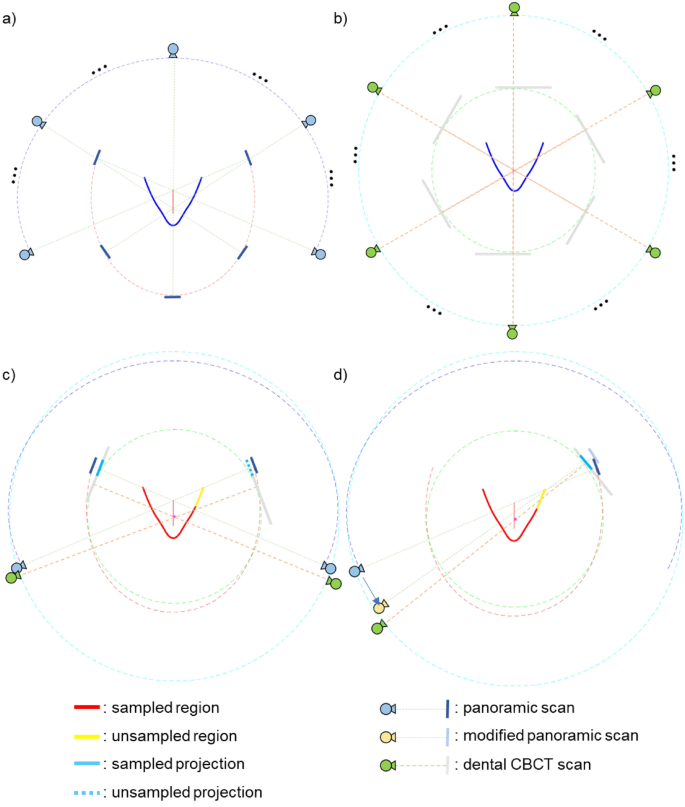
(a) Panoramic scan system. (b) Dental CBCT scan system. (c) Initial panoramic scan trajectory and sampling issue. (d) Modifying panoramic scan trajectory.
Due to the movement of the rotation axis in the panoramic scan system and the asymmetry of the detector fan-angle in the dental CBCT system, some projection data of the set panoramic scan trajectory cannot be obtained from the dental CBCT projection data as shown in Fig. 4c. The upper right tail part of the dental arch, represented by the yellow line segment, in this work would be subject to such data loss. The reason why specific panoramic projection data cannot be extracted from the dental CBCT projection data is that the beam path is too far from the fixed rotation axis of the dental CBCT system to be covered by the short fan-angle of the offset detector. In this work, we approximated those missing panoramic projection data by extending the virtual panoramic scan range so that the CBCT projection data that covers the yellow tail of the dental arch can be used for panoramic tomosynthesis as shown in Fig. 4d. Extending the virtual panoramic scan trajectory thus allows the beam path of the corresponding view to be closer to the rotation axis of the dental CBCT scan system.
After setting a virtual panoramic scan trajectory as described above, virtual panoramic projection data were extracted from the CBCT projection data. Since the source positions along a panoramic scan trajectory are not exactly overlapping those along a CBCT scan trajectory, ray matching and rebinning are necessary. The target panoramic beam was first transformed into a parallel beam through fan-parallel rebinning32. After that, the CBCT beam corresponding to the target panoramic beam was found by converting the parallel beam into a fan beam according to the CBCT system. Both panoramic beam and CBCT beam geometries are shown in Fig. 5. First, we convert the panoramic beam into the parallel beam as shown in Fig. 5a. Sop represents the source position of the panoramic scan, Dp detector plane, and Op represents the rotation axis. ({upbeta }_{mathrm{p}}) represents the panoramic beam source angle, ({upgamma }_{mathrm{p}}) represents the fan-angle and (uptheta) represents the corresponding parallel beam angle. ({mathrm{u}}_{mathrm{p}}) represents the panoramic beam detector coordinate, ({mathrm{s}}_{mathrm{p}}) represents the virtual fan-beam detector coordinate, ({mathrm{t}}_{mathrm{p}}) represents the radial parallel coordinate, D is the distance from the source to the rotation axis and R is the distance from the rotation axis to the detector surface. The relationship between (left(uptheta ,{mathrm{t}}_{mathrm{p}}right)) and (left({upbeta }_{mathrm{p}},{upgamma }_{mathrm{p}},{mathrm{s}}_{mathrm{p}}right)) is given by Eq. (1).
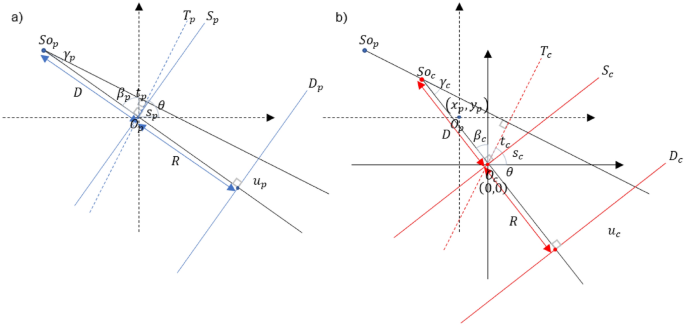
(a) Geometry of panoramic beam. (({mathbf{S}mathbf{o}}_{mathbf{p}}), Source position; ({mathbf{D}}_{{varvec{p}}}), Detector position; ({mathbf{O}}_{{varvec{p}}}), Rotation center), (b) Geometry of CBCT beam. (({mathbf{S}mathbf{o}}_{mathbf{c}}), Source position; ({mathbf{D}}_{mathbf{c}}), Detector position; ({mathbf{O}}_{mathbf{c}}), Rotation center).
$$left{begin{array}{c}{mathrm{s}}_{mathrm{p}}={mathrm{u}}_{mathrm{p}}frac{D}{D+R}\ genfrac{}{}{0pt}{}{{upgamma }_{mathrm{p}}=mathrm{atan}left({mathrm{s}}_{mathrm{p}}/mathrm{D}right)}{uptheta ={upgamma }_{mathrm{p}}+{upbeta }_{mathrm{p}}}\ {mathrm{t}}_{mathrm{p}}=frac{D{s}_{p}}{sqrt{{D}^{2}+{s}_{p}^{2}}}end{array} right.$$
(1)
As shown in Fig. 5b, the parallel beam is now converted again into a CBCT fan beam. ({mathrm{So}}_{mathrm{c}}) represents the source position of the CBCT scan system, ({mathrm{D}}_{mathrm{c}}) detector plane, and ({O}_{mathrm{c}}) represents the rotation axis. Unlike ({O}_{p}), ({O}_{mathrm{c}}) has a fixed position. ({upbeta }_{mathrm{c}}) represents the CBCT beam source angle, ({upgamma }_{mathrm{c}}) represents the fan-angle, ({mathrm{s}}_{mathrm{c}}) represents the virtual fan-beam detector coordinate, ({mathrm{t}}_{c}) represents the radial parallel coordinate. The relationship between (left(uptheta ,{mathrm{t}}_{mathrm{p}},{t}_{c}right)) and (left({upbeta }_{mathrm{c}},{upgamma }_{mathrm{c}},{mathrm{s}}_{mathrm{c}}right)) is given by Eq. (2).
$$left{begin{array}{c}{mathrm{t}}_{mathrm{c}}={mathrm{t}}_{mathrm{p}}+{mathrm{x}}_{mathrm{p}}costheta +{mathrm{y}}_{mathrm{p}}sintheta \ genfrac{}{}{0pt}{}{{mathrm{t}}_{mathrm{c}}=frac{D{s}_{c}}{sqrt{{D}^{2}+{s}_{c}^{2}}},{mathrm{s}}_{mathrm{c}}=frac{D{t}_{c}}{sqrt{{D}^{2}-{t}_{c}^{2}}}}{{mathrm{u}}_{mathrm{c}}={mathrm{s}}_{mathrm{c}}frac{D+R}{D}}\ genfrac{}{}{0pt}{}{{gamma }_{c}=atanleft({s}_{c}/Dright)}{{beta }_{c}=theta -{gamma }_{c}}end{array}right.$$
(2)
We can convert the panoramic beam (left({upbeta }_{mathrm{p}},{upgamma }_{mathrm{p}},{mathrm{s}}_{mathrm{p}}right)) to the CBCT beam (left({upbeta }_{mathrm{c}},{upgamma }_{mathrm{c}},{mathrm{s}}_{mathrm{c}}right)) using the two equation sets. In this way, panoramic projection data can be extracted from CBCT projection data along the virtual panoramic projection scan trajectory.
The second issue to be addressed is attenuation correction in panoramic projection data synthesis. In the projection rays that pass through the cervical vertebra in particular, the ray integrals of attenuation coefficients are much higher than those of projection rays that do not pass through the cervical vertebra. In the existing panoramic scan systems, the low-intensity projections caused by the cervical vertebrae are usually compensated by increasing the beam energy or effectively increasing the exposure in the relevant scanning range. However, in the case of panoramic projection data synthesis from CBCT projection data, the beam intensity in the raw projection domain should be appropriately corrected for by software.
As can be seen from Fig. 6, the synthesized panoramic projection data shows a substantial nonuniformity, and this nonuniformity directly translates to the reconstructed panoramic image. In this study, after calculating the average pixel value of the entire panoramic projection data (({mathrm{m}}_{mathrm{tot}})) and the average pixel value of each projection data (({mathrm{m}}_{mathrm{proj}})), an appropriate weight for each projection data is computed based on the ratio of the average pixel values (({mathrm{w}}_{mathrm{proj}}= {mathrm{m}}_{mathrm{tot}}/{mathrm{m}}_{mathrm{proj}})). The view-by-view weighting factor thus acquired was then multiplied to all the pixels in the corresponding projection.
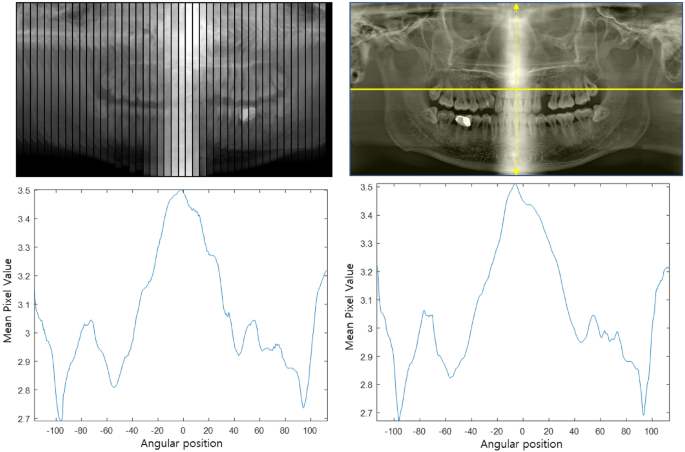
(Left) The mean pixel value of panoramic projection data according to angular position, (Right) the mean pixel value of panoramic image according to angular position.
Panoramic image reconstruction
A panoramic image is now reconstructed using the acquired panoramic projection data. In this paper, the tomosynthesis-based panoramic image reconstruction method, which is frequently used in the conventional panoramic scan system, was used. The tomosynthesis-based panoramic image reconstruction method uses the shift-and-add method with varying amounts of shift for producing multi-focal plane images10,12. The position of the focal plane on which the panoramic image is formed depends on the shift amount10,12. As the shift amount increases, a focal plane is generated farther from the source; and as the shift amount decreases, a focal plane is generated closer to the source. It is therefore possible to create a panoramic image of multiple slices with different depths of focus along the dental arch. To obtain a single panoramic image with the best focus, an auto-focusing method is applied that divides the sliced image into patches and finds and combines those with the highest sharpness. We would like to refer to our earlier publication for more details on the auto-focusing method12. Finally, the following edge enhancement algorithm was applied to increase the visibility of the acquired panoramic image18.
$$I= {alpha }_{0}{I}_{0}+{alpha }_{1}left({I}_{0}-{G}_{1}right)+{alpha }_{2}left({I}_{0}-{G}_{2}right)+{alpha }_{3}left({I}_{0}-{G}_{3}right)$$
(3)
, where ({alpha }_{mathrm{n}}) denotes the weighting factors used to control the level of details and ({G}_{n}) represents a 2D Gaussian filtered image of the original panoramic image ({I}_{0}). The values of ({alpha }_{mathrm{n}}) used in this work were empirically set by: ({alpha }_{0}=1.0,{alpha }_{1}=1.0,{alpha }_{2}=1.5,{alpha }_{3}=1.5). The waists of the Gaussian filtering functions were: ({upsigma }_{mathrm{G}1}=2.4,{upsigma }_{mathrm{G}2}=4.8,{upsigma }_{mathrm{G}3}=19.2). (I) represents the final panoramic image.
Data acquisition
Clinical dental CBCT projection data of 40 patients were retrospectively collected after de-identification under the institutional review board (IRB) approved all methods and the waived of informed consent by Well Dental Clinic in Teheran-ro, Seoul, Republic of Korea. All methods in this work were performed in accordance with the guidelines and regulations of Well Dental Clinic IRB. Also, a head phantom was scanned for a comparison study. The data sets were acquired using a rainbow CT (Dentium, Republic of Korea) scanner with 94 kVp, 8 mA (pulsed mode) parameters. The CBCT scanner used in this study is a 2-in-1 device with panoramic scanning capability. The scan parameters used in the CBCT scan system and the panoramic scan system are summarized in Table 1.

