
This retrospective study was conducted in compliance with the World Medical Association Declaration of Helsinki on medical research. Ethical approval was obtained from the Ethical Review Board of the University Hospitals Leuven (reference number: B322201525552).
Dataset
A total of 200 CBCT scans (46 males and 54 females; age range: 8–54 years) having uni- or bilateral maxillary impacted canine cases were collected during the period 2015–2022, from the radiological database of UZ Leuven Hospital, Leuven, Belgium. Inclusion criteria consisted of previously clinically and radiologically diagnosed unilateral/bilateral, horizontal/oblique/vertical and complete/partial maxillary canine impactions. Teeth with both complete and partially formed roots were included. The majority of cases in these datasets had orthodontic brackets. Exclusion criteria involved scans with motion artifacts and poor image quality, where margins of canine could not be optimally delineated. The CBCT images were obtained utilizing two devices, NewTom VGi Evo (Cefla, Imola, Italy) and 3D Accuitomo 170 (J Morita, Kyoto, Japan) with variable scanning parameters of 90–110 kV, a voxel size between 0.125 and 0.300 mm3 and a field of view between 8 × 8 and 24 × 19 cm.
All images were exported in Digital Imaging and Communications in Medicine (DICOM) format. Thereafter, the DICOM datasets were uploaded to a CNN-based online cloud platform known as the ‘Virtual patient creator’ (Relu, Leuven, Belgium), to assess if the tool would be able to segment impacted canines, as it had been previously trained for permanent erupted teeth segmentation24,28. Based on the visual assessment by two observers (A.S, B.E), 100 images from the total dataset of 200 images could not be segmented automatically by the platform. Hence, these failed cases were randomly divided into two subsets, training set (n = 50), to train and better fit the CNN model for impacted canines using semi-automatically segmented ground truth data; and testing set (n = 50), to test the model performance for AS compared to the ground truth data. Figure 1 illustrates the data distribution for training and testing subsets.
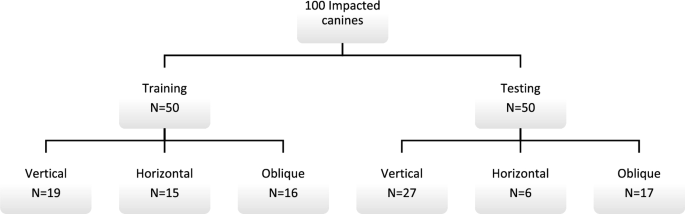
Dataset used for training and validation.
Data labelling
The ground truth for the training and testing sets was obtained through SS of impacted canines on the online platform using cloud tools such as the contour tool and smart brush function26. The contour tool interpolates the interslice region between selected contours, while the smart brush function groups voxels based on their intensities. The operator adjusted the segmentation until satisfied with the result, and all contours were verified in axial, coronal, and sagittal planes. The segmentation was performed by one observer (A.S) and subsequently reassessed by two additional observers (NM & RJ) with 10 and 25 years of experience, respectively. The canines were then exported as standard tessellation language (STL) files for further processing in the CNN pipeline.
AI architecture
The training of the CNN model involved the utilization of two 3D U-Net architectures (Fig. 2), each comprising four encoding and three decoding blocks. The architecture included two convolutional layers with a kernel size of 3 × 3 × 3, ReLU activation function, and group normalization with eight feature maps. Max pooling with a kernel size of 2 × 2 × 2 and strides of two was applied to reduce the resolution by a factor of two across all dimensions25,27.
Binary classifier training (0 or 1) was performed on both networks. All scans were resampled to a uniform voxel size. To circumvent GPU memory limitations, the entire scan was down-sampled to a fixed size. A low-resolution segmentation was achieved using the first 3D U-Net to propose 3D patches. The segments corresponding to the impacted canines were only extracted. A second 3D U-Net was employed to segment and fuse the relevant patches, which were subsequently used to construct a full-resolution segmentation map. The binary image was binarized, retaining only the largest connected component, and a marching cubes algorithm was applied. The resulting mesh was smoothed to generate a 3D model. The optimization of the model parameters was performed using a deep learning model optimization technique known as ADAM31, with an initial learning rate set to 1.25e4. During the training process, random spatial augmentations such as rotation, scaling, and elastic deformation were applied.

Model testing and consistency of refined segmentations
The performance of the CNN model was evaluated using a testing set and compared to the ground truth obtained through SS performed by observer B.E. The images were uploaded to the online tool and the resulting AS was downloaded in STL file format. Moreover, a visual evaluation of the segmented testing set was performed by two observers (A.S, B.E) to determine if any refinements were necessary (Fig. 3). If required, these refinements were implemented using the brush function on the online tool to add or remove voxels from the selection. The refined segmentation was also downloaded in STL file format. The intra- and inter-observer repeatability of refined segmentations was confirmed by both observers performing the refinements twice at a two-week interval.

Automated segmentation of maxillary impacted canine and other dentomaxillofacial structures (maxillary bone, maxillary sinus and erupted teeth) on virtual patient creator platform (creator.relu.eu, Relu BV, Version October 2022).
CNN performance evaluation
The CNN model’s performance was evaluated based on time duration and voxel- and surface-based metrics.
Time analysis
The duration of testing set segmentation with the SS approach was recorded using a digital stopwatch, starting from the import of CBCT data until the generation of the canine model. On the other hand, the online platform automatically provided the time needed to obtain the final segmentation map.
Performance metrics
The performance of the CNN model was assessed by utilizing confusion matrix for voxel-wise comparison of SS ground truth and AS maps according to the following metrics: Dice similarity coefficient (DSC), Intersection over union (IoU) and 95% Hausdorff Distance (HD). In addition, the surface-based analysis involved importing superimposed STL files of SS and AS to 3-matic software (Materialise NV, Leuven, Belgium), followed by automated part comparison analysis to calculate the root mean square (RMS) difference between both segmented models.
Statistical analysis
Data were analyzed using GraphPad Prism, Version 9.0. (GraphPad Software, La Jolla, CA). A paired sample t-test was used to compare the time between SS and AS. The performance metrics were represented by mean and standard deviation values. An IoU score of < 0.5 or HD value of > 0.2 mm would indicate towards poor performance. Inter-class correlation coefficient (r) was applied to assess intra- and inter-observer consistency of the refined segmentations. A p value of less than 0.05 was considered significant.
Informed consent
Since data were evaluated retrospectively, pseudonymously and were solely obtained for treatment purposes, a requirement of informed consent was waived by the Ethical Review Board of the University Hospitals Leuven (reference number: B322201525552).