Study design
The retrospective study protocol conformed to the Declaration of Helsinki and was approved by the institutional review board of Yonsei University Dental Hospital (2-2022-0073) and passed the exemption review for informed consent on the use of patients’ radiography and medical records. The study sample was acquired from the Department of Orthodontics archives of the adult patients who underwent orthognathic surgical therapy between 2010 and 2018 at Yonsei University Dental Hospital, Seoul, Republic of Korea. The inclusion criteria for the study were: (1) age > 18 years; (2) history of clinical diagnosis of skeletal asymmetry defined by the presence of ≥ 4 mm deviation of the menton (anteroinferior point on the chin) from the facial midsagittal plane21; and (3) availability of serial CBCT data sets of a large field of view (FOV) and a voxel size ≤ 0.4 mm. The exclusion criteria were (1) history of maxillofacial trauma, (2) CBCT images of insufficient quality due to motion blurring artifacts, and (3) difference of FOV between serial CBCT images.
A total of 57 records with multiple serial CBCT images were identified, from which 29 records that met the inclusion criteria were selected (19 males and 10 females; mean ± SD age, 22.10 ± 3.22y; range, 18–32y). Each of the selected records had a minimum of three serial CBCT volumes. The CBCT volumes were then categorized as T0, T1, and T2. Here, T0 was the first CBCT volume recorded for an individual, with T1 and T2 being the second and third serially collected volumes.
Image preprocessing
All CBCT scans were acquired under the same parametric settings at standard operational settings of the hospital (80 kVp; 10 mA) with Alphard3030 (Alphard Roentgen Ind., Ltd., Kyoto, Japan).
The voxel resolution of 0.39 mm for a 200 mm × 200 mm field of view was acquired with a maximum scan time of 17 s. The obtained scan data was accessed in digital imaging and communication in medicine (DICOM) format and anonymized before further computational processing. The algorithm proposed was implemented and tested by Python 3.7.13 on a CPU (Intel(R) Core (TM) i7-10750H, 2.60 GHz) and GPU (NVIDIA GeForce RTX 3060. 8 GB) system.
Figure 2 provides a graphical representation of the preprocessing step from the multi-stack raw DICOM data. The preprocessing step defines a region of interest (ROI) that forms the main operating region for subsequent orientation assignments. The DICOM data is 2D rendered, and ROI is defined in the naso-orbital region. With the help of Otsu’s thresholding algorithm, the noise and soft tissue were eliminated for extraction of the dentoskeletal region22. A 3D convex hull was then processed over the segmented skull images. Because the skull is concave within a limited range except near the nose tip, there are no elements of the convex hull in the vicinity except near the apex of the nasal region, like the green dot in Fig. 2. Therefore, among all convex hull elements whose x, z coordinates are within the 2D nose ROI, only the points near the nasal projection can be selected. The nose tip can be uniquely defined by obtaining the average of these points. Hence, using together the information from 2D ROI and the result from the convex hull, automated identification of the highest projection point within the naso-orbital region of the skull was made. This point is referred to as ‘nose tip’ from here on.

Schematic representation of the initial preprocessing step. This step determines the outermost projection in the naso-orbital region within the three-dimensional segmented images.
Intermediary arrangement
The described preprocessing approach was applied individually to each serially obtained CBCT image. An intermediary’ arrangement’ was performed to harmonize the orientation between the serial images. In this step, the CBCT volumes were arranged with the nose tip as the reference before the new global axis was defined. This step enables an improved agreement between the new global axes of the multiple serial volumes, as detailed in the next section.
Orientation assignment
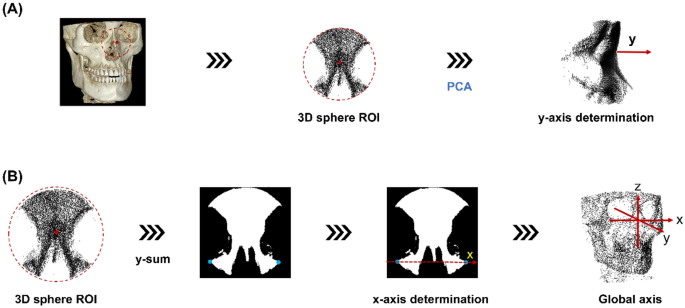
In the segmented skull image, 3D sphere ROI is defined as a sphere with a radius of 35 mm centered on the nose tip obtained in the previous step. The point distribution in the 3D spherical ROI, centered on the tip of the nose, appears larger along the face of the skull and smaller in the direction corresponding to the depth of the skull. That is, the axis with the smallest PCA component of the 3D skull ROI is in the depth of the skull, which represents the anteroposterior head orientation. Therefore, we defined the new y-axis as the axis with the smallest component of PCA (Fig. 3A).

Orientation assignment. Determination of the (A) y-axis followed by (B) x-axis determination from the 3D spherical region of interest (ROI). The global axis orientation assignment is completed with a z-axis definition.
A 2D image is obtained by summation of the 3D spherical ROI of the skull in the newly determined y-axis direction. Binarization is performed by setting the region with a value greater than 0 to 1. In the 2D image, with only the image of the bottom half from the center, the two points at the far ends of the x-axis are automatically selected. The direction of the straight line passing through the two points (blue) is determined as the new x-axis, as shown in Fig. 3B. A third perpendicular axis, the z-axis, was defined with the newly obtained x and y axes allowing the completion of the 3D global axis. With the help of the redefined 3D global axis, CBCT reorientation was completed.
Evaluation measures
Improvement in goodness of alignment
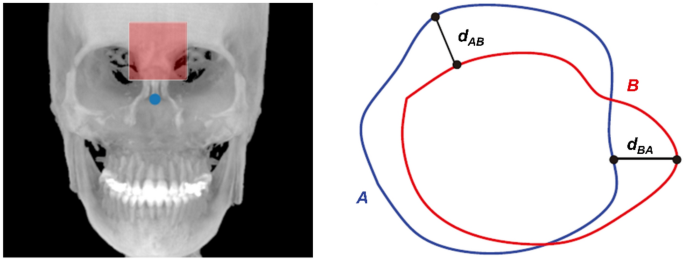
We performed a quantitative and qualitative evaluation of the changes in the serial CBCT images. The quantitative changes were evaluated by comparing the angular changes with the redefined 3D global axis. The assessment of the general alignment between serial images with the HD was performed and computed for serial image pairs: T0T1, T0T2, and T1T2 using Eq. (1)
$$HD left( {A,B} right) = maxleft[ {{text{min}}_{A} left{ {dleft( {A,B} right)} right}, {text{min}}_{B} left{ {dleft( {B,A} right)} right}} right]$$
(1)
where d stands for the 3D Euclidean norm, and A and B represent the two sets derived from the forehead surface (Fig. 4), such that a lower HD value indicates the goodness of alignment23,24.

A schematic showing the Hausdorff distance between points sets A and B from the forehead surface (red shaded box).
Changes in the HD value after processing via the proposed protocol were compared, herein referred to as ‘matching improvement.’ Additionally, the impact of the intermediary step was evaluated by comparing the HD changes with and without the arrangement.
Comparing goodness of alignment based on severity of asymmetry
With K-medoids clustering, the original data were clustered into three groups based on the clinical magnitude of asymmetry: mild (4–4.5 mm), moderate (4.5–9.5 mm), and marked (> 9.5 mm). The groups were then compared for HD matching improvement after the PCA-based reorientation to evaluate the pairwise goodness of alignment as described above. Lastly, qualitative visualization of the images was performed to depict the summed alignment of the serial CBCT volumes.

