In vitro validation: CBCT segmented volumes (OsiriX MD and 3D Slicer) versus real volumes (laser scanning and water displacement method)
Five freshly extracted maxillary anterior teeth, cleaned, disinfected, and stored as per the Occupational Safety and Health Administration (OSHA) guidelines were included in the study. The teeth were decoronated at the cemento-enamel junction (CEJ) following which the root canal orifices were sealed with Glass ionomer cement (Fuji IX; GC, Tokyo, Japan). Radiographic imaging and 3D segmentation: CBCT scans was obtained for the 5 samples using the CS 9000 3D: Carestream Dental, Atlanta, GA, USA). Each sample was placed in a wax block to prevent any movement during the scanning process. Scanning parameters were fixed at voxel size: 76 µm; FOV: 50 (times) 37 mm; tube potential: 70 KVp; tube current: 10 mA; exposure: 10.68 s. The acquired data was exported as a DICOM file into the two imaging platforms. I.e., OsiriX MD (v 9.0, Pixmeo SARL, Bernex Switzerland, https://www.osirix-viewer.com) and 3D Slicer (v 4.8.1, https://www.slicer.org). Tooth segmentation was performed on both the software’s by semi-automated technique with manual refinement on a repeated two-dimensional basis followed by automated computation of the radiographic volume in cubic centimeters (cm3). (See Fig. 1A,B) Laser scan: The samples were coated with HC 92(Flaw Test Developer, Amol Chemicals, India) to facilitate scanning. The laser scan was performed with the Steinbichler COMET L3D laser equipment (steinbichler, Optotechnik GmbH, Germany). The laser-scanned 3D models were exported as STL format files and imported into Materialise MiniMagics (v 23.5, Materialise, Belgium, https://www.materialise.com/en/software/minimagics) software for quantitative analysis (Fig. 1C).
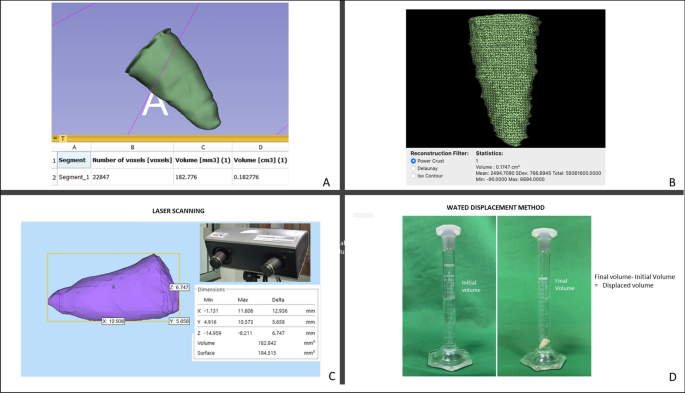
In vitro Validation. Tooth root volume assessment by CBCT segmentation with (A) OsiriX MD and (B) 3D Slicer software’s. (C) Illustrates volumetric analyses of the tooth root in Materialise MiniMagics software after scanning with Steinbichler COMET L3D laser equipment. (D) Illustrates volume estimation of the tooth root by water displacement method.
Water displacement method
The volume of each of the samples was measured by the water displacement method in a 5 ml graduated cylinder with 0.1 ml gradations (Rankem, Haryana, India). The cylinder was filled with water at room temperature up to the 4 ml mark. The specimen was immersed completely in the cylinder and the new water level was recorded at the lowest portion of the meniscus. The volume of the specimen was determined by subtracting the initial water volume from the final water volume (Fig. 1D) The measurements obtained were in milliliters (mL), which were converted into cubic centimeters (cm3) to unify the readings with the other techniques11. (See Table 1).
Clinical application
Informed consent was obtained from patients or their parents/guardians. The study protocol was approved by the Central ethics committee, Nitte University, Mangalore, India (NU/CEC/Ph.D./-03/2014). The research was carried out in accordance with guidelines and regulations set down in the declaration of Helsinki. This research included CBCT scans of 35 teeth in 28 patients aged 8–38 years with one or more immature permanent teeth with pulp necrosis and apical periodontitis caused either by trauma or caries. Clinical examination focused on the presence of spontaneous pain, swelling, tenderness, and sensitivity to palpation. Cold and electric pulp tests were also performed. Intraoral periapical digital radiographs revealed immature teeth with open apices, showing either wide canals or blunderbuss canals—and in some cases, moderately developed roots but with open apices, along with periapical radiolucency (see Table 2).
REP protocol
The treatment protocol followed the clinical guidelines proposed by the American Association of Endodontists, as well as the European Society of Endodontology’s position statements12,13. The treatments were performed between August 2013 and May 2017 by a single operator using a dental operating microscope (Karl Kaps, Oberkochen, Germany) under a rubber dam.
In the first appointment, after a local anaesthetic with adrenaline was administered, an endodontic access cavity was made, followed by disinfection of the root canal using 1.5% NaOCl. The canal was then dried by aspiration (without air blow) and the application of sterile paper points, followed by the application of 1 mg/mL triple antibiotic paste. The tooth was sealed with an intermediate restorative material (IRM) (Dentsply International, Milford, DE, USA) and recalled after two to three weeks. In the next appointment, the response to the initial treatment was assessed. If clinical signs and symptoms continued to persist, the same treatment protocol was repeated.
If the tooth was symptom-free and the canal was found to be dry, the REP was carried out as follows. The root canal was re-entered and irrigated with a copious amount of 1.5% NaOCl to remove the antibiotic dressing material and all debris. The root canal dentin was conditioned using EDTA 17% followed by laceration of the apical tissue with a sterile 23-gauge needle to induce bleeding into the root canal so that the canal would fill with blood to the level of the cementoenamel junction (CEJ). A sterile, biodegradable collagen plug (CollaPlug; Zimmer Biomet, Warsaw, IN, USA) was placed over the blood clot, which served as a scaffold. A coronal seal, made from either white mineral trioxide aggregate (MTA) (ProRoot; Dentsply Sirona, Ballaigues, Switzerland) or Biodentine (Septodont, aint-Maur-des-Fosses, France), was placed as close as possible to the level of the CEJ. Then, the tooth was sealed with glass ionomer cement (Fuji IX; GC, Tokyo, Japan), followed by a composite restoration (Filtek Z250/Z350; 3 M ESPE, Saint Paul, MN, USA). At the end of the procedure, a CBCT scan was obtained (CS 9000 3D; voxel size: 76 µm; FOV: 50 (times) 37 mm; tube potential: 70 KVp; tube current: 10 mA; exposure: 10.68 s; Carestream Dental, Atlanta, GA, USA).
Follow-up
Patients were recalled at six-month intervals after REP. At each recall session, a digital periapical radiograph was taken, and clinical tests were performed. Clinical success was defined as a tooth that survived and did not require another endodontic intervention during the recall period14. Once significant radiographic changes were evident during the observation time, a final follow-up CBCT scan was taken (CS 9000 3D; voxel size: 76 µm; FOV: 50 (times) 37 mm; tube potential: 70 KVp; tube current: 10 mA; exposure: 10.68 s; Carestream Dental, Atlanta, GA, USA).
Volume measurements
The initial and the final CBCT datasets were processed to quantify changes in the post-REPT pulp space volume using two biomedical DICOM software programs: OsiriX MD (v 9.0, Pixmeo SARL, Bernex Switzerland, https://www.osirix-viewer.com/osirix/osirix-md/) and 3D Slicer (v 4.8.1, https://download.slicer.org/).The pulp space volume was measured by an endodontist who was proficient in the use of OsiriX MD. The “closed polygon selection” tool, found under the ROI tool button, was used to trace the boundary of the pulp space on alternate slices (axial images, slice thickness: 0.3 mm) from a fixed coronal reference point (i.e., the end of the coronal seal) to the apex of the root. After outlining only half of the slices between the two reference points, the missing ROI can be generated using the “generate missing ROIs” tool under the ROI dropdown menu. The “Grow Region (2D/3D Segmentation)” algorithm facilitates this automated process based on the differences in Hounsfield units between the pulp space and the surrounding hard tissues. The automated outlines are manually adjusted using the “closed polygon selection” tool and the “repulsor tool” to refine the ROI (see Fig. 2A). After collecting all the ROI within one series, the “ROI volume” tool automatically calculates the volume by multiplying surface and slice thickness and then adds up the individual slice volumes to construct a 3D model (Fig. 2B). The Macintosh operating system was used (Mac OS; Intel Core i5, 1.8 GHz, 4 GB RAM).
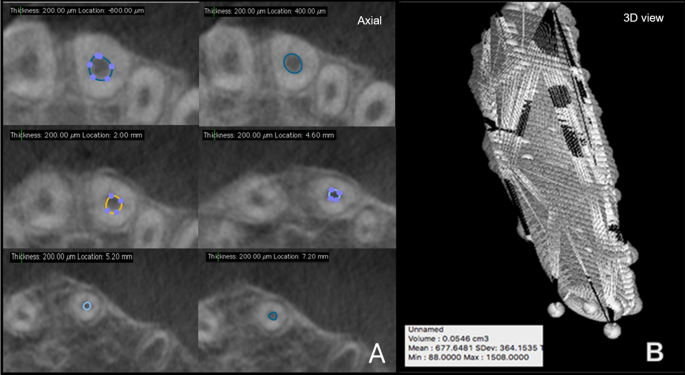
Pulp space volume assessment using OsiriX MD (A) illustrates the ROI in various axial slices and (B) reconstructed 3D model along with the volume statistics.
The volume measurements using the 3D Slicer software were taken by an experienced endodontist with prior experience of the software and their plug-ins. The Macintosh operating system was used (Mac OS; Intel Core i5, 1.8 GHz, 4 GB RAM). Pulp space was segmented using the GrowCut technique and morphological operations such as erosion, dilation, and island removal.
The following workflow was performed for pulp space segmentation: (a) the CBCT dataset was loaded into 3D Slicer, b) identification of a region inside the pulp space preceded by a stroke with a brush size of around 0.5 cm beyond the pulp space (see Fig. 3A), (c) automatic competing region-growing was performed using GrowCut (see Fig. 3B), (d) editing tools were used for manual refinement after visual inspection of results (qualitative assessment), and (e) “quantification” module was used to extract the pulp space volume (see Fig. 4).
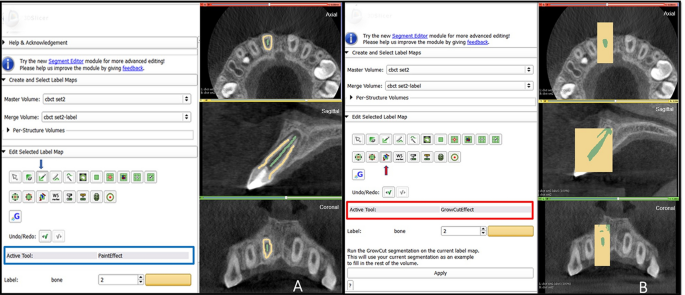
Grow Cut technique in 3D Slicer (A) initialization of an area inside and outside the ROI using paint effect (blue arrow). (B) automatic competing region- growing using GrowCut effect (red arrow).
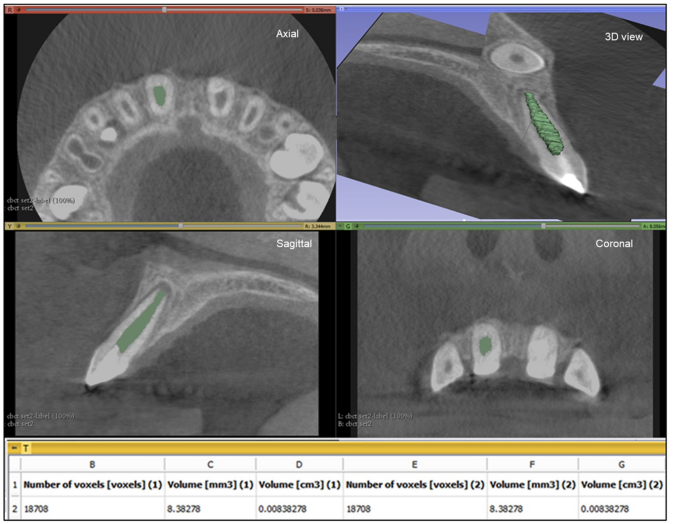
Pulp space volume assessment using 3D Slicer: illustrates the ROI in the axial, saggital and coronal slicing as well as the reconstructed 3D model with the calculated volume.
3-dimensional superimposition
Voxel- based superimposition was carried out using the CM Freg extension of the 3D slicer. Cranial based registration of the pre and post pulp space volume segmentations were done under the growing modules of CMF reg in 3D slicer. During the superimposition (registration), the post pulp volume segmentation is moved and automatically superimposed on a static pre pulp volume segmentation creating a registered surface model. (See Fig. 5A–C) Digital subtraction: The change in volume post REP was alternatively analyzed by “pixelwise subtraction” of the post pulp volume from the pre pulp volume using the “Subtract scalar volume” parameter under the “Filtering” module of the 3D slicer. The resultant volume was quantified using the “segment statistics parameter” under the “quantification” module.
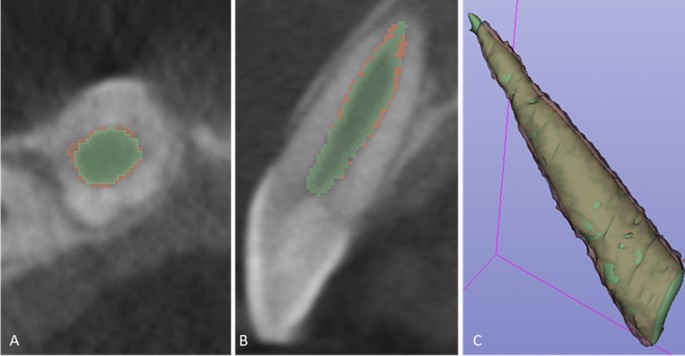
Voxel-based superimposition. Axial slice (A), sagittal slice (B) and 3d reconstruction (C) showing post pulp volume segmentation (green) superimposed over the pre pulp volume segmentation (brown).
Both evaluators conducted the measurements separately and were blinded to each other’s results. A separate dataset of five patients was evaluated to assess intra-observer variability, producing a mean Dice similarity coefficient of 90.45 ± 2.71 (OsiriX MD) and 93.16 ± 2.56 (3D Slicer). Because intra-observer reliability was high for both evaluators, the measurements were performed only once.
The results were generated in millimeter and centimeter cube units and the data presented in percentage (see Table 3).
Data analysis
Statistical analysis of the data was performed using SPSSS (v 21.0, IBM). For In vitro validation a comparison between the CBCT segmented volumes (OsiriX MD and 3 D Slicer) and real volumes (laser scan and water displacement method) for the five samples was undertaken to check the sensitivity of the two software programs. Correlation between groups was performed to determine the reliability of the recorded volumes. Data was analyzed using Bland Altman method and Intraclass correlation coefficient.
For Clinical data analysis, normality of numerical data was assessed using the Shapiro–Wilk test and parametric tests were used for comparisons. Intergroup comparisons were made using the t-test. The intragroup comparison was made using paired t-test. A P-value < 0.05 was considered as significant, keeping α error at 5% and β error at 20%, thus giving power to the study as 80%.

